What If Falling Test Scores Aren't About Screen Time, But About What Kids Are Drinking? ReBalU May Have a Solution


In 2024, 12th-grade NAEP math and reading scores hit their lowest levels ever recorded. The usual suspects lined up immediately — pandemic learning loss, screen time, chronic absenteeism, underfunding. All plausible. But the decline started well before COVID, and none of those explanations account for a pattern hiding in plain sight: over the exact same decades that scores eroded, artificial sweeteners quietly colonized the American diet. No-sugar sodas, sports drinks, energy drinks, low-calorie alcoholic beverages — sucralose, aspartame, and acesulfame-K are now in virtually everything marketed as "healthy" or "zero sugar" to young people.
That alone is a coincidence. What makes it more than a coincidence is the biology underneath it and a diagnostic platform called ReBalU, developed by SOD Sciences, that may be the missing tool to prove the connection.
The Enzyme Most People Have Never Heard Of
SOD2 is the apex mitochondrial antioxidant enzyme, the first line of defense against oxidative stress inside every cell. Its gene carries a variant called rs4880, and the risk allele (Val/T, on the modern strand) reduces the enzyme's import into the mitochondria and cuts its activity by 30–40%. That single-point loss doesn't stay contained. It propagates downstream, impairing GPX1 and GPX4 — the glutathione peroxidases that handle the next layer of oxidative cleanup.
Here's the part nobody talks about: the risk allele isn't rare. It sits near 0.50 in Europeans, ~0.58 in African ancestry populations, and is near-fixed (TT) in East Asians. The low-antioxidant genotype isn't the exception. It's the global majority.
What Sweeteners Do to That System
A controlled human trial found that sucralose significantly reduced memory, encoding, and executive function — the exact cognitive substrates that underlie reading comprehension and math reasoning. Separately, Ace-K and sucralose have been shown to disrupt the gut microbiome and suppress butyrate production. Butyrate is the short-chain fatty acid that maintains gut barrier integrity; when it drops, systemic inflammation rises. That inflammation is causatively tied to metabolic disease and correlatively tied to neuroinflammation.
Now layer the genetics on top. If your SOD2 is already running at 60–70% capacity and your glutathione pathway is compromised, the inflammatory hit from sweetener-driven butyrate loss doesn't get buffered. It lands. And it lands on the neural circuits responsible for the skills that standardized tests measure.
The Convergence Nobody Has Tested
Each link in this chain has real, published support. The case isn't any single proven step — it's the convergence:
- Most people are genetically antioxidant-compromised (SOD2 rs4880 allele frequencies).
- Artificial sweeteners plausibly raise oxidative and inflammatory load (sucralose trial, microbiome disruption data).
- The cognitive domains sweeteners impair are the ones tests measure (executive function, encoding memory).
- Scores declined over the exact window sweetener penetration expanded (NAEP trend data, pre-pandemic onset).
Yet no study has ever regressed sweetener exposure against K–12 test scores stratified by antioxidant genotype. The endpoints in existing work stop at memory tasks, brain imaging, or disease outcomes. The keystone study — the one that connects sweetener intake to actual school performance in genetically defined subgroups — has never been run.
Why a Simple "Sweeteners vs. Scores" Study Won't Work
A naive population-level correlation between sweetener consumption and test scores would be torn apart — rightly — by confounders. Kids who drink more diet soda might also have more screen time, lower SES, worse sleep. You'd never untangle it.
But stratification by genotype changes the game entirely. If you divide the same population into antioxidant strata — CC/sufficient, TC/intermediate, TT/deficient — and the sweetener-score relationship appears only or predominantly in the compromised group, that's not a confounder pattern. Screen time doesn't interact with SOD2 genotype. Neither does absenteeism. A clean gene × environment interaction is the specific signature that separates causation from noise.
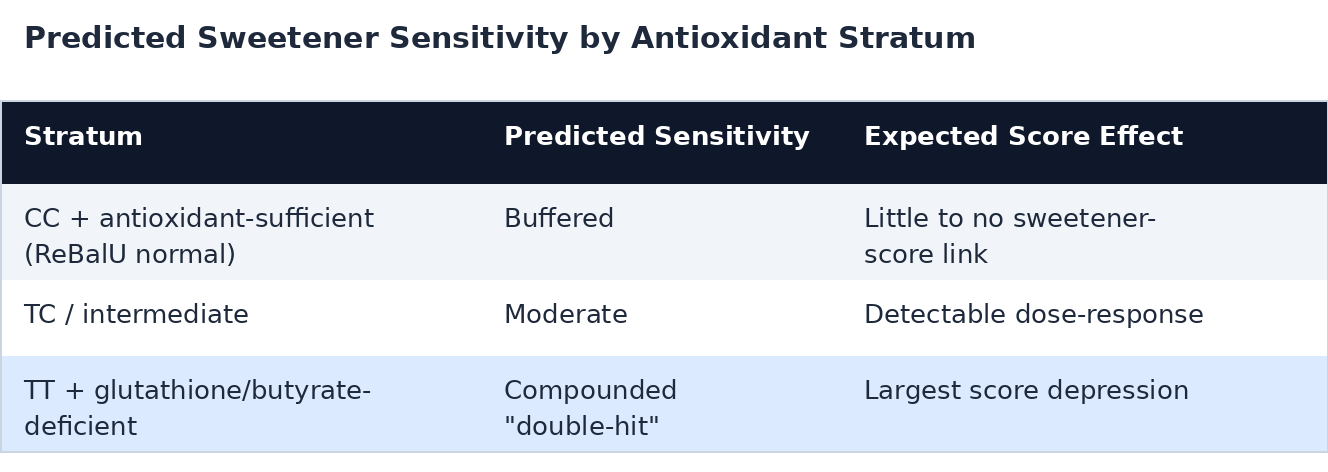
That predicted fan-out — negligible effect in the buffered group, escalating through the intermediate, largest in the double-hit stratum — is a pattern no uniform "sweeteners are fine" or "sweeteners are bad for everyone" model can produce.
GENESIS-K12: The Study That Would Settle It
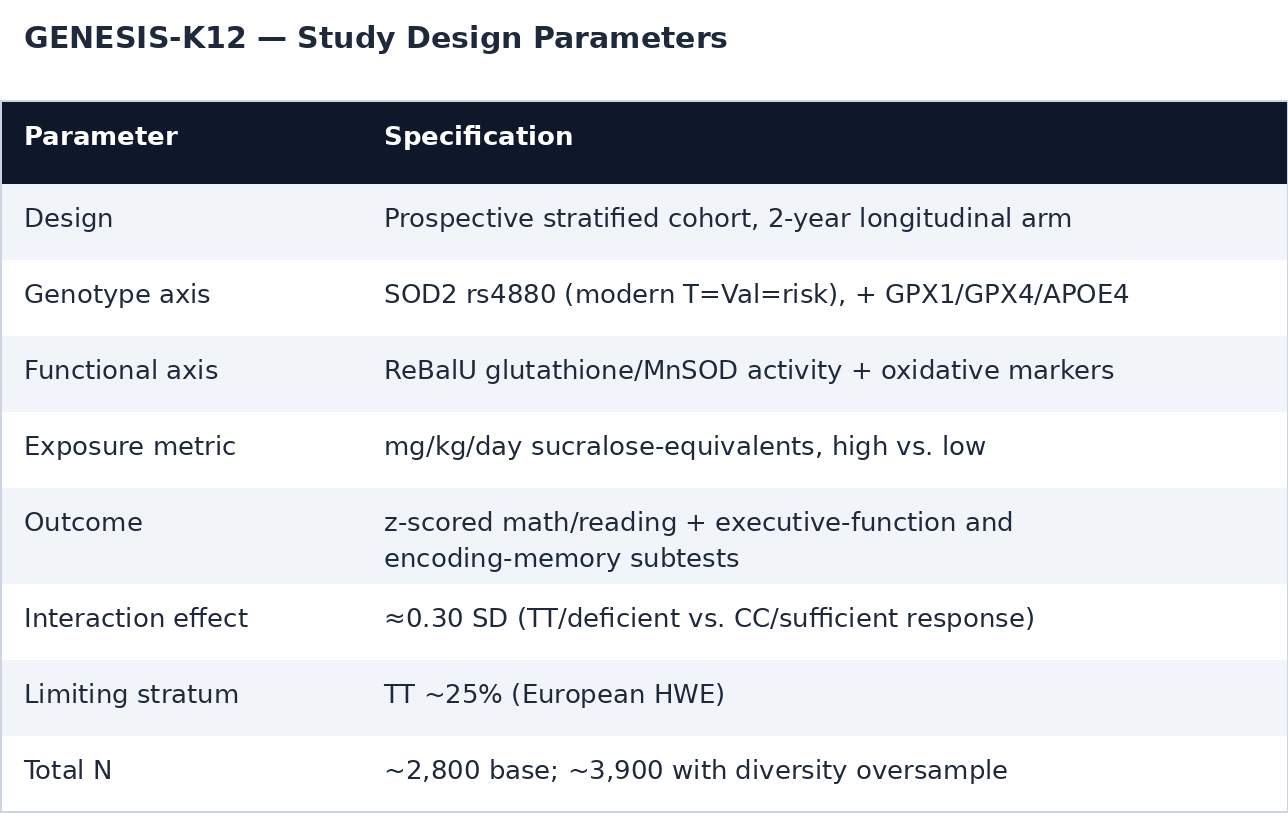
The protocol is called GENESIS-K12 — Gene × Sweetener Interaction on Cognitive Performance. It's a prospective observational cohort with stratified recruitment and a nested longitudinal arm tracking score trajectories over two academic years. The primary hypothesis: high artificial-sweetener exposure predicts lower standardized math and reading scores predominantly in the antioxidant-compromised stratum, producing a significant gene × exposure interaction rather than a uniform main effect.
The design stratifies on three axes. First, SOD2 rs4880 genotype (TT / TC / CC), with GPX1 rs1050450, GPX4 rs713041, and APOE4 as secondary genotype terms. Second, a ReBalU functional antioxidant readout — glutathione and MnSOD activity plus oxidative-stress markers — as the moderator that overrides genotype where alleles are near-fixed (critical for East Asian and African-ancestry cohorts where nearly everyone is TT). Third, butyrate status as a gut-axis covariate.
Exposure is captured through a validated sweetened-beverage frequency questionnaire, converted to mg/kg/day sucralose-equivalents and dichotomized at high versus low. The outcome is z-scored grade-level math and reading, plus executive-function and encoding-memory subtests that map directly to the sucralose-sensitive cognitive domains from the trial literature.
The Statistical Signature That Would Prove It
The keystone is the interaction term, not a main effect:
Y_score = β₀ + β₁G + β₂E + β₃(G × E) + β₄R + β₅(R × E) + γX + ε
where G = genotype stratum, E = sweetener exposure, R = ReBalU functional readout, and X = the full confounder set (SES, screen time, absenteeism, ancestry principal components, parental education). The hypothesis lives in β₃ and β₅. A significant negative interaction means exposure depresses scores specifically in the compromised stratum — the signature that distinguishes causation from the confounders the education field currently blames.
Sample-size logic powers on the interaction contrast (≈0.30 SD) between TT/deficient and CC/sufficient responses to exposure: ~349 participants per design cell at 80% power, α=0.05. TT is the limiting stratum at ~25% under European Hardy-Weinberg equilibrium, driving a base total of ~2,800 — but because the European-skewed evidence base understates true risk-allele prevalence, the protocol oversamples for ancestry diversity to ~3,900 to capture the near-fixed-TT East Asian and high-T African groups.
What the Data Would Look Like If the Hypothesis Is Right
Score deficits stay negligible in CC/sufficient students even under high sweetener exposure. But they widen sharply — fanning out to roughly −0.45 SD in the TT/deficient high-exposure cell. Almost half a standard deviation. That's the difference between a student testing at the 50th percentile and one testing at the 33rd.
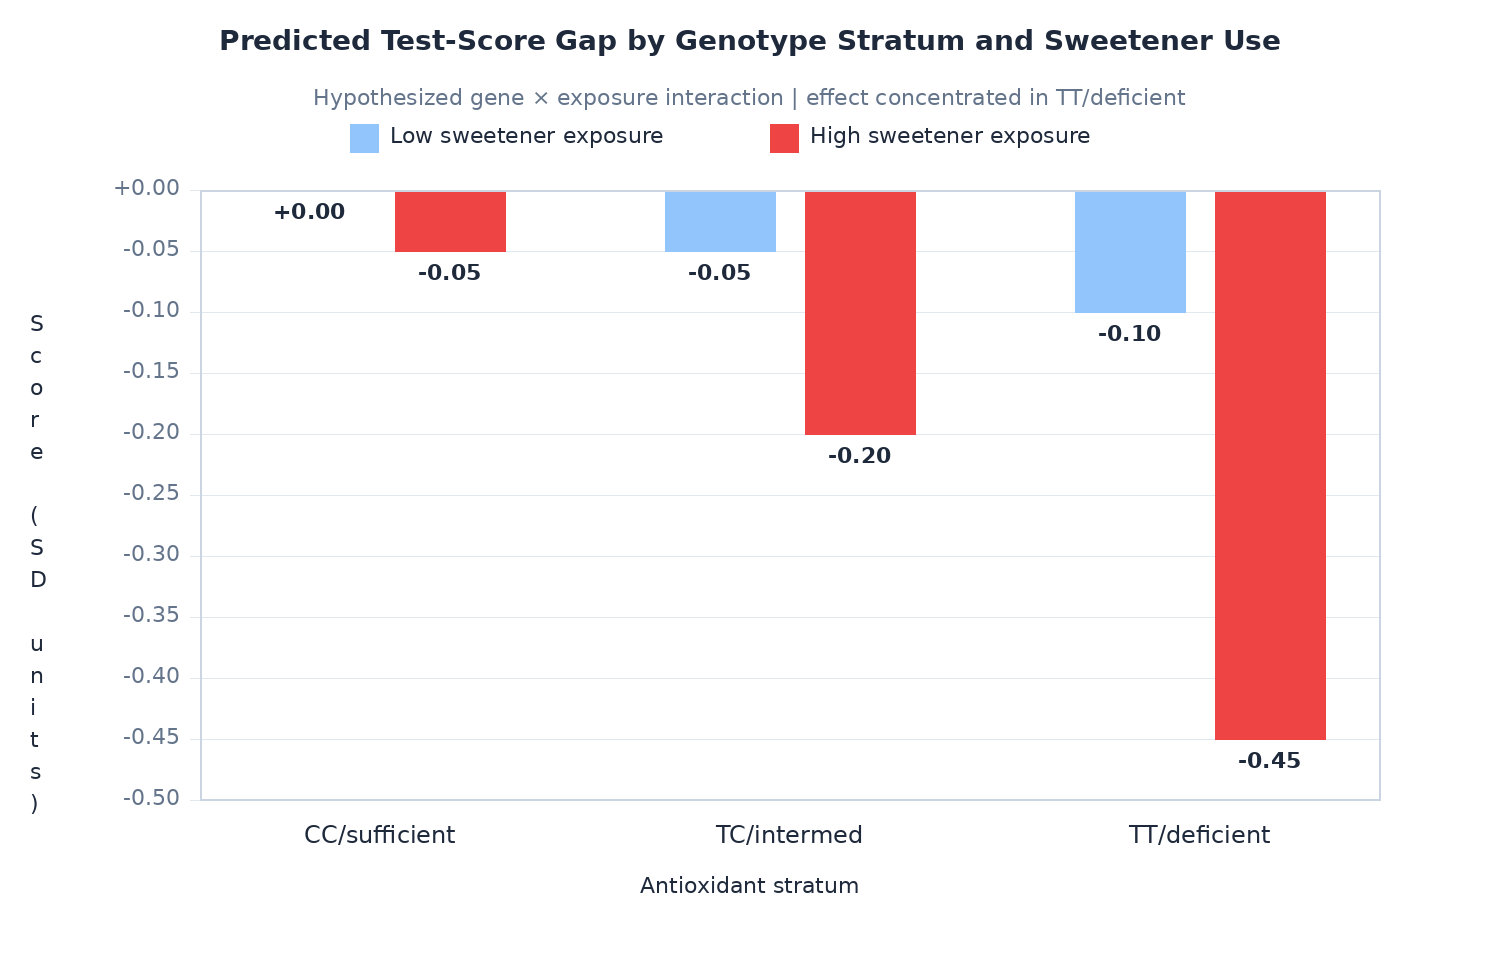
No uniform model predicts that pattern. Only a gene × environment interaction does.
Why the Field Has Missed This
The structural bias in the existing literature runs deep. Genomic and clinical cohorts are overwhelmingly European-ancestry, which means "normal" antioxidant reference ranges are anchored to the one population carrying the protective C(Ala) allele at the highest rate. In a European cohort, roughly 25% are CC (fully protected), ~50% are TC (intermediate) — so the average effect of sweeteners on cognition gets diluted toward null by the buffered majority. The true TT-driven signal gets washed out.
It gets worse: in East Asian populations where TT is near-universal, there's no CC comparison group within the same ancestry — so the interaction can't surface at all unless you design for it.
GENESIS-K12 is specifically engineered to solve this. Ancestry-diverse recruitment ensures the full genotype spectrum is represented. The ReBalU functional readout overrides genotype labels where they're uninformative — because in a population that's 95% TT, the genotype axis collapses, and only a functional measurement of actual antioxidant capacity can differentiate who's truly compromised from who's compensating through diet, supplementation, or other pathways.
What This Isn't and What It Is
This is not proof. It's a protocol and a prediction. The effect sizes are plausible assumptions drawn from the sucralose memory trial and SOD2 functional data — not measured outcomes, which is precisely what the study exists to generate.
But the convergent mechanistic evidence makes it biologically coherent that artificial sweeteners disproportionately depress cognition — and therefore test scores — in the antioxidant-compromised majority. And that effect is likely masked in conventional research by genotype mislabeling and reference-range bias. ReBalU's functional stratification is the instrument that could surface a signal the existing evidence base is structurally blind to.
If β₃ is significant, the study will have demonstrated that artificial sweeteners depress cognition in the antioxidant-compromised majority — and that the field missed it through anchoring bias baked into its own cohort design.
If β₃ is null, the study will have produced the first rigorous test and protected the platform from an overclaim.
Either way, the question deserves an answer. Because right now, nobody is asking it.
JD Unfiltered — Strategic Research