Volatility 99 Years Apart: The 1927 to 1929 and 2026 to 2028 Market Analog


Rising volatility, foundational tech adoption, a booming and widening market.
The call. The war has only delayed our market melt-up call, and as a result it starts now.
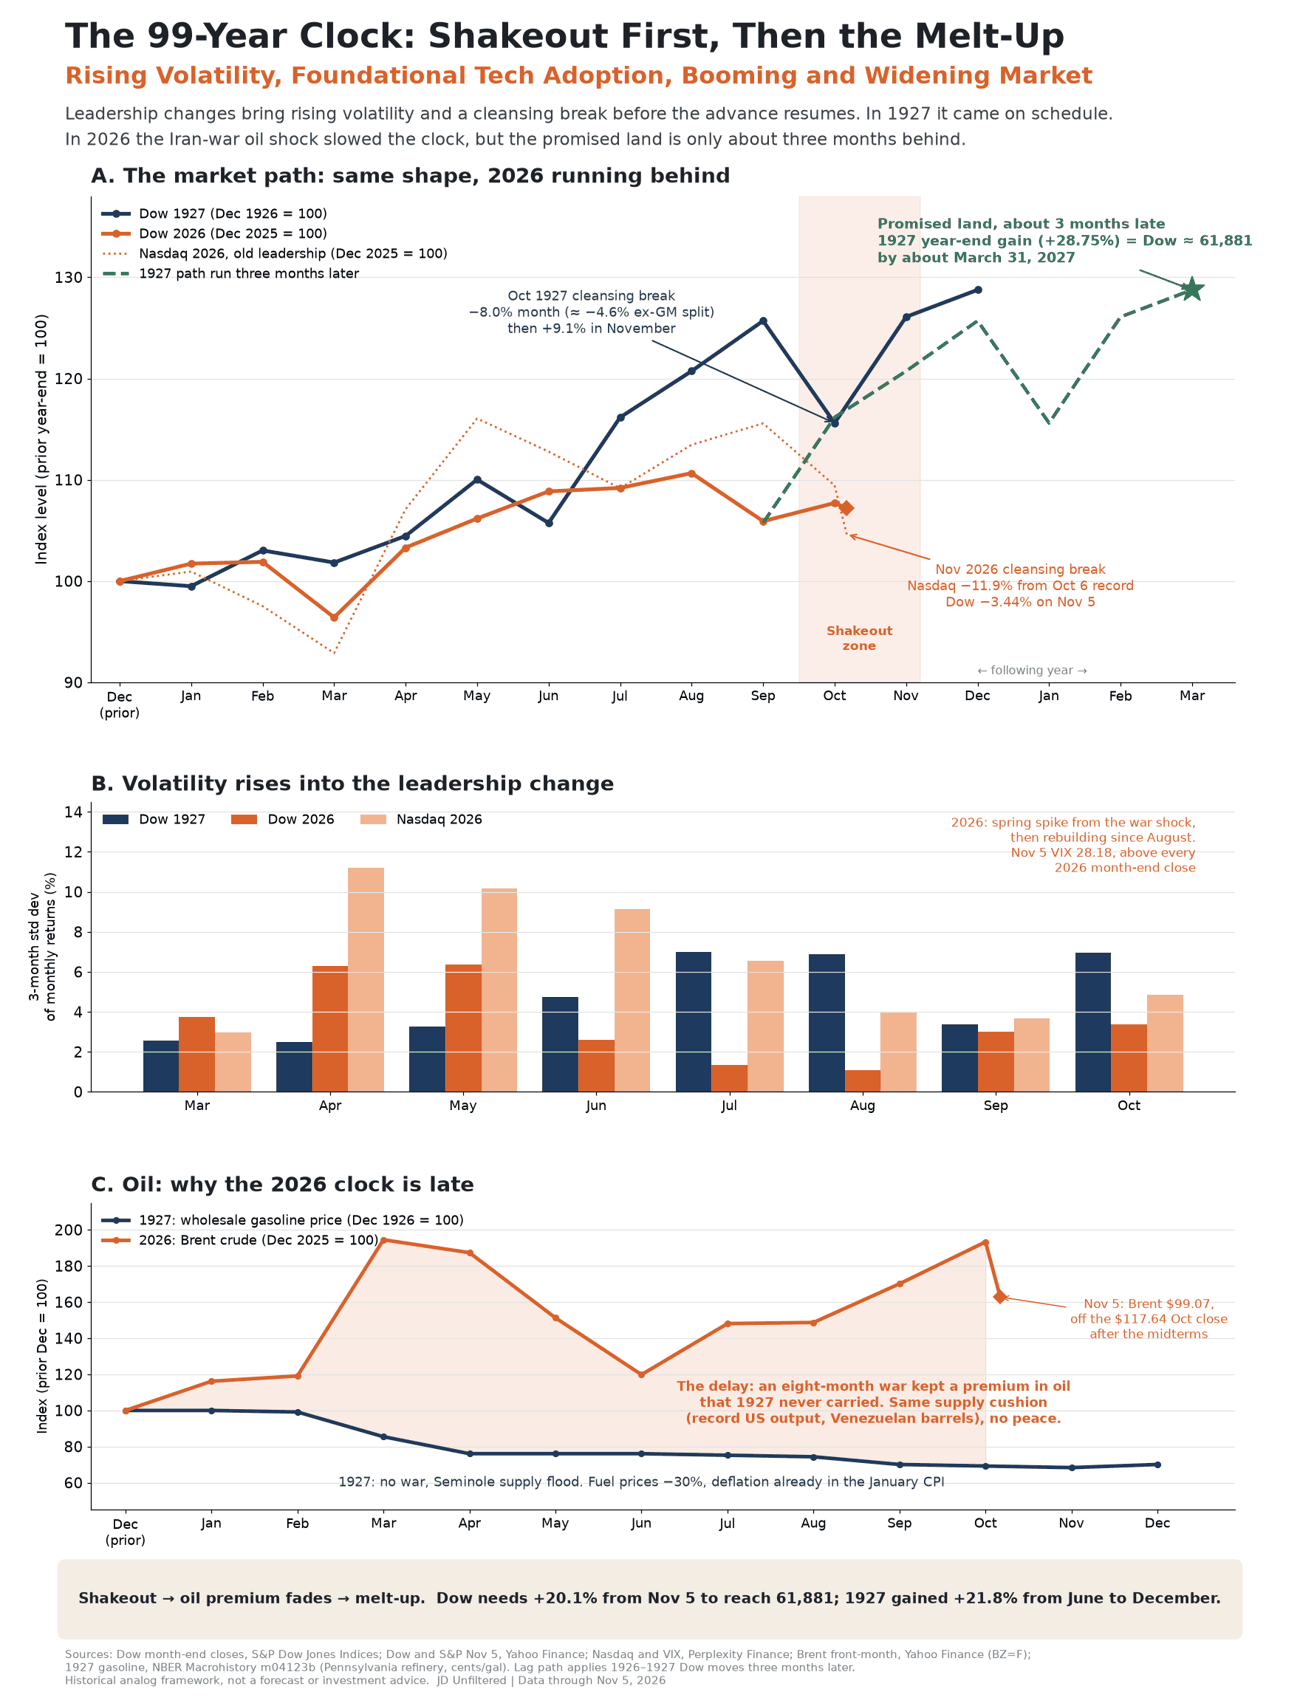
An eight-month Iran war, fought directly rather than by threat and proxy as Coolidge handled Mexico in 1927, kept a premium in oil and pushed the disinflation that 1927 enjoyed early in the year into late 2026. That cost the 99-year clock about three months, not the call. This week's shakeout, a 3.6 percent productivity quarter with falling unit labor costs, oil back below $100 and an election that makes ending the war a political necessity put the conditions for 1927's second-half advance in place now.
The thesis
Rising volatility is not, by itself, a sell signal. When a fundamental technology is being adopted at an accelerating pace, volatility tends to rise alongside prices, because the same forces that pull capital into the new economy, meaning rapid earnings revisions, new-era narratives, easy financing and speculative leverage, also make the ride rougher. The clearest historical case is the 1927 to 1929 market, when factory electrification, radio and the automobile drove the Dow Jones Industrial Average up 142.5 percent from the end of 1926 to its September 3, 1929 peak of 381.17, while monthly volatility rose year after year.
In 1927 that advance also had help from oil: a geopolitical oil confrontation with Mexico that never became a war, and a flood of new supply that cut oil prices and deepened deflation early in the year. 2026 has the supply but not the peace, and the gap between those two years explains much of why 2026 is running behind.
This paper places 2026 on the same 99-year clock, with 1927 as 2026, 1928 as 2027 and 1929 as 2028, and measures it with the same yardsticks: monthly Dow closes, monthly volatility, leadership, inflation, bond yields and Federal Reserve policy. The data now run through ten full months plus the first four trading days of November 2026.
Part I: The volatility signature
Month by month, 1927 vs. 2026
The scorecard through October
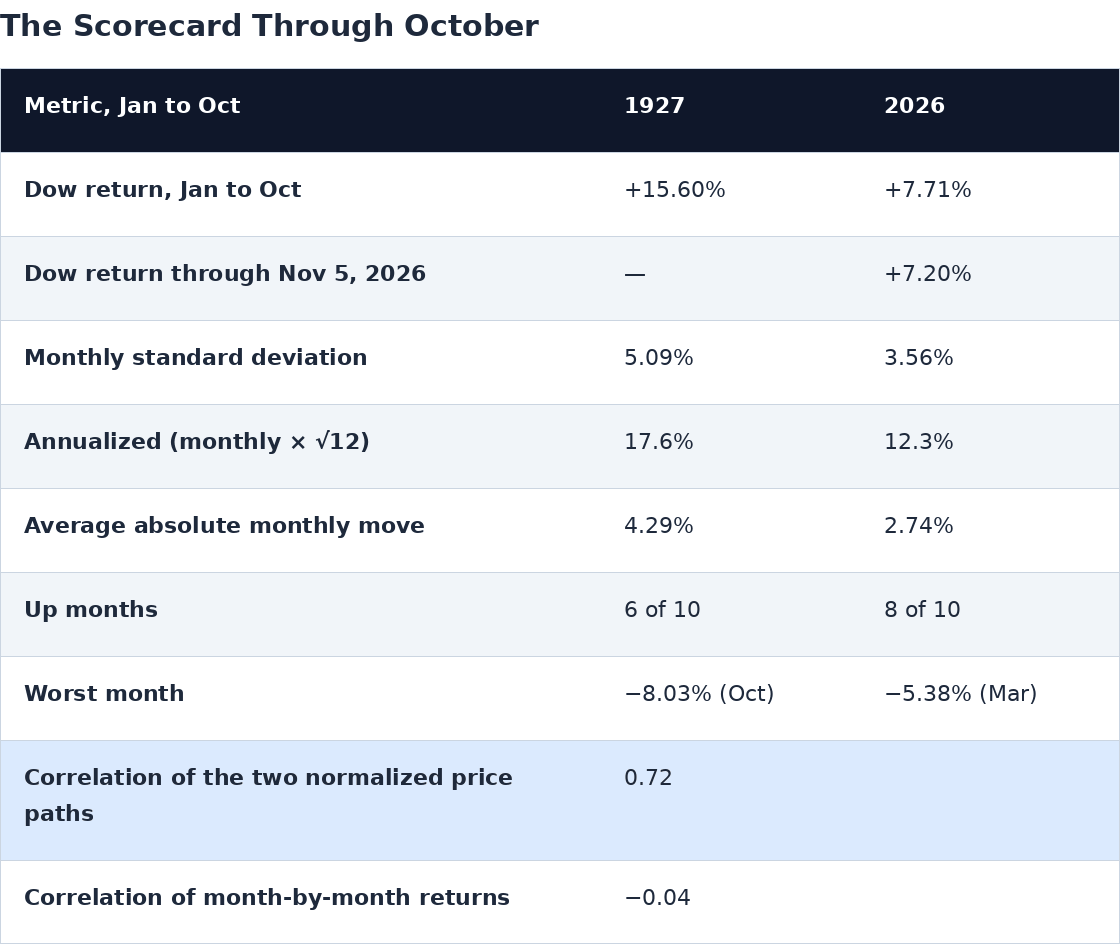
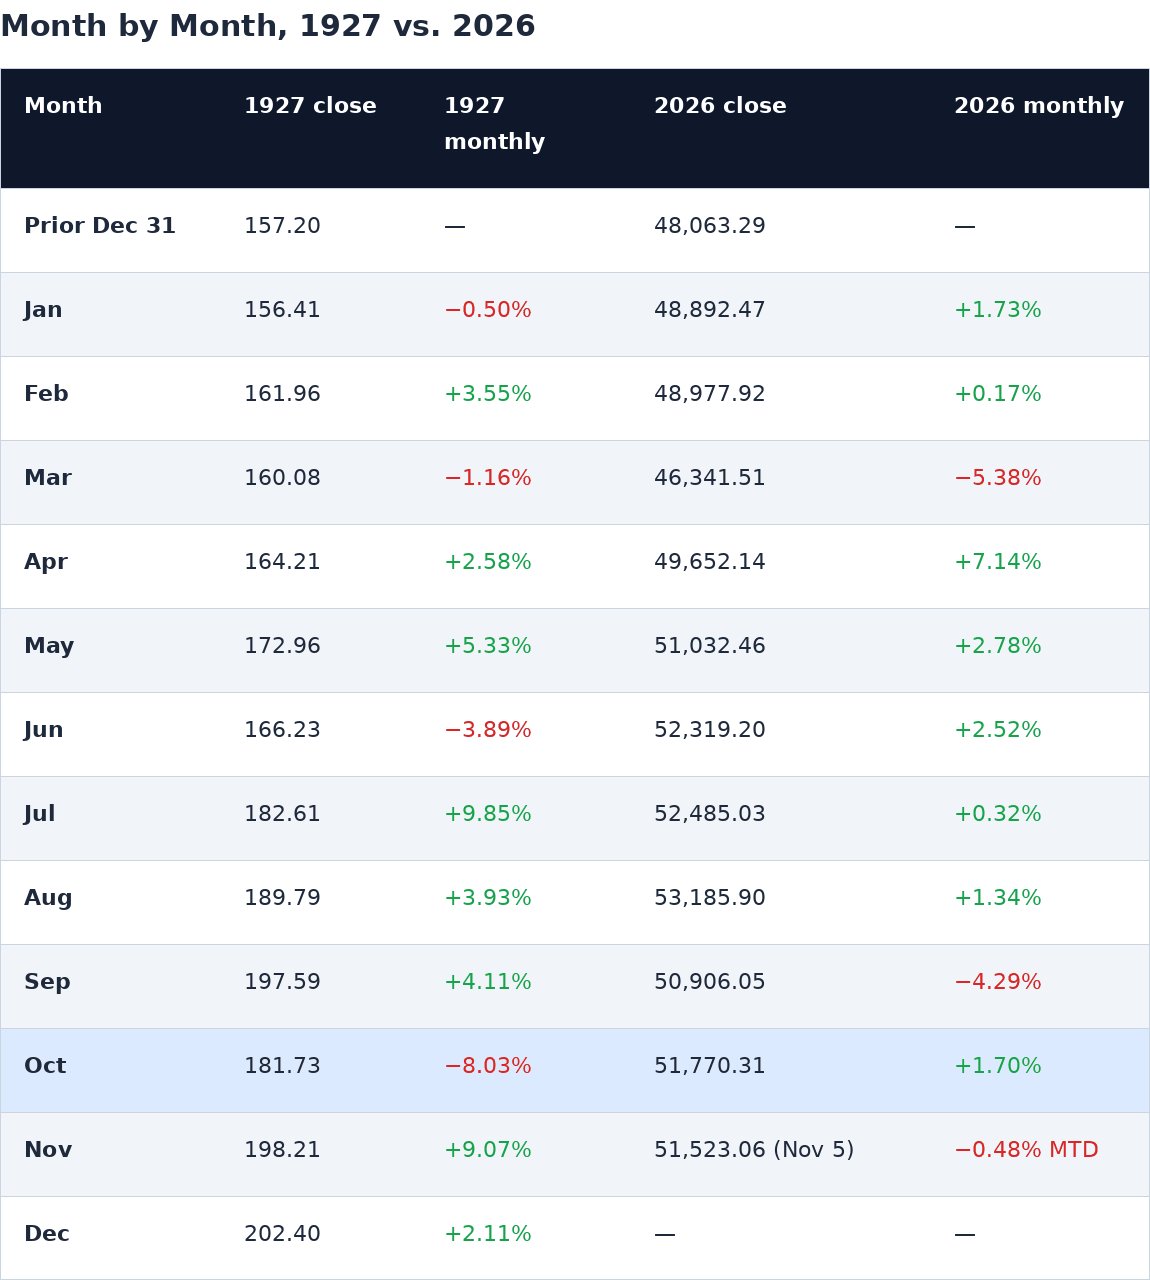
Two conclusions follow. First, the two years have the same shape: a choppy first quarter, a spring advance, a late-summer high and a sharp autumn break, and their normalized price paths correlate at 0.72. Second, the months do not line up one for one, with a return correlation near zero, and the 2026 Dow is running at roughly half of 1927's pace with about two-thirds of its monthly volatility.
Where the volatility lives in 2026
The Dow is a 30-stock, price-weighted index of mostly mature companies. In 1927 it was the market's leadership gauge. In 2026 the technology-adoption trade sits in the Nasdaq. Measured where the new technology actually trades, 2026 volatility already exceeds 1927's Dow.
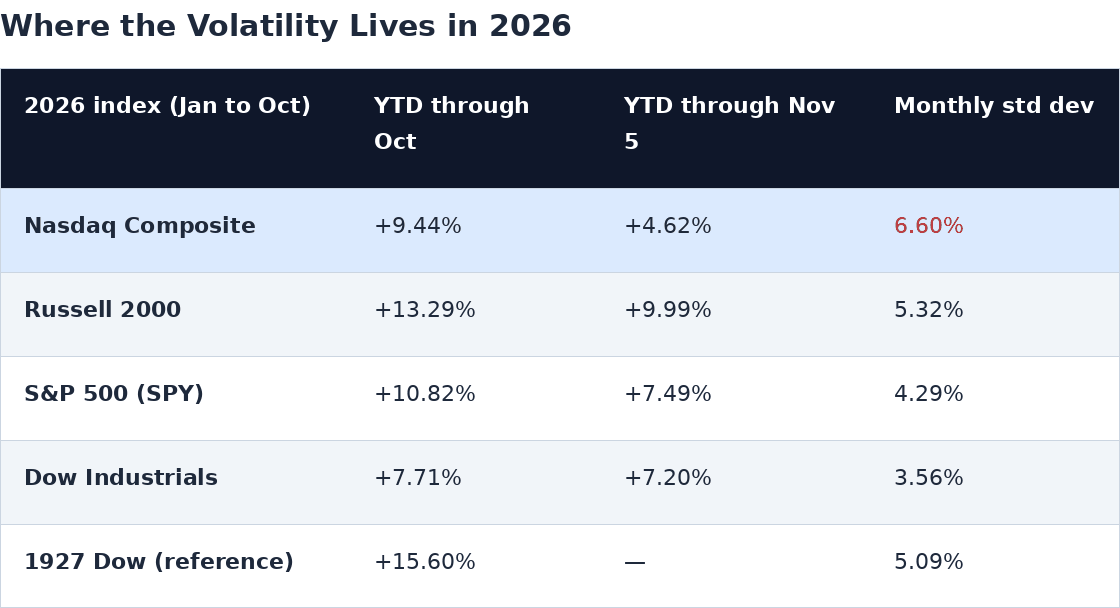
The Nasdaq's April and May surge, up 15.29 percent and 8.36 percent, followed by a 5.30 percent October decline, is the 2026 version of 1927's 9.85 percent July gain and 8.03 percent October loss: large moves in both directions, concentrated in the leadership group.
Rolling three-month volatility
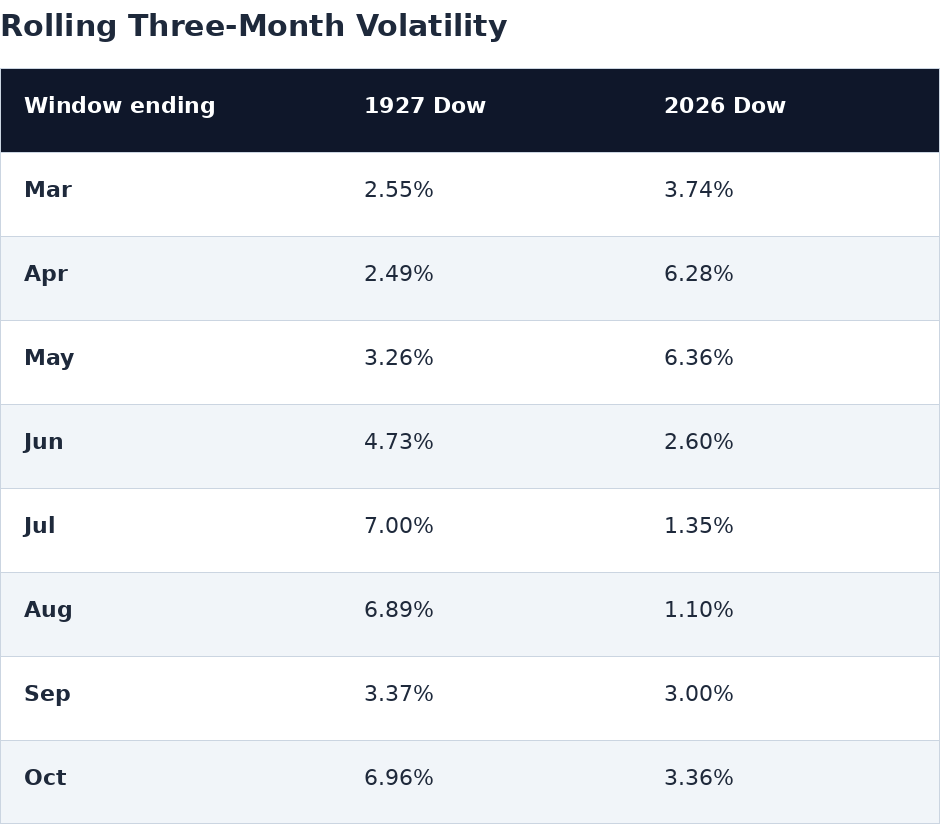
2026 front-loaded its volatility, with the Iran-war March and the April rebound, then went unusually calm through the summer. 1927 did the opposite: calm early, then rising swings into the second half. Since September, 2026 volatility has been climbing again, and the first week of November accelerated it sharply.
Part II: The October rhyme
The most striking parallel of the year arrived on schedule.
1927. The Dow set an all-time high of 199.78 on Monday, October 3, 1927, then "declined heavily," reaching 181.75 by October 21, as brokers' loans kept "establishing new high records," the Commercial & Financial Chronicle reported on October 22, 1927. Two days after the high, a "veritable whirlwind of speculation" pushed volume to 3,152,473 shares before stocks reversed and "were poured into the market," the New York Times reported on October 5, 1927. Part of October's 8.03 percent decline was mechanical: the average was "reduced arbitrarily by 6.82 points on Oct. 8" when General Motors split its shares, according to the Chronicle. Excluding that adjustment, the underlying October decline was about 4.6 percent. November 1927 then rallied 9.07 percent, and the Dow closed the year at a record 202.40.
2026. The Nasdaq Composite set its record close of 27,599.89 on October 6, 2026, and by November 5 had fallen more than 10 percent into correction, Reuters reported. October was the Nasdaq's worst month in over a year as investors questioned whether AI spending would deliver returns, CNN Business reported. The first week of November then delivered a two-day whipsaw that belongs in the same family as October 1927.
Wednesday, November 4. After Democrats won both chambers of Congress and oil fell more than 8 percent, the Dow rose 1,569.40 points, or 3.03 percent, to 53,356.12, its best day since April 2025.
Thursday, November 5. The Dow fell 1,833.06 points, or 3.44 percent, to 51,523.06. The S&P 500 fell 4.36 percent, its worst day since April 2025, and the Nasdaq fell 5.5 percent. The Philadelphia chip index fell 12 percent, its second-biggest fall on record, on fears the new Congress could slow the AI data-center buildout, Reuters reported.
VIX. The CBOE Volatility Index closed November 5 at 28.18, above every 2026 month-end reading, including the 25.25 close at the end of the Iran-war March.
The pattern matches the thesis: a new-technology leadership group hits a record, speculation peaks in a high-volume reversal, and a sharp break follows while the underlying adoption story stays intact. In 1927 that break was a pause, not a top.
Part III: Technology adoption, the engine behind the volatility
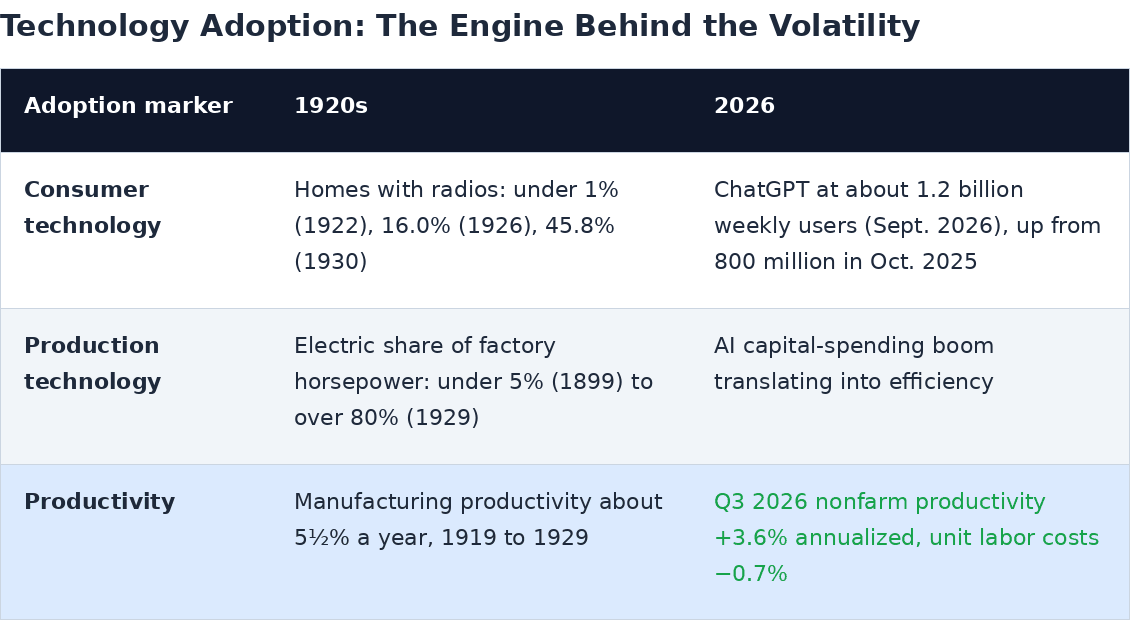
The November 5 productivity report is the strongest fundamental confirmation of the year: productivity rose 3.6 percent against a 3.0 percent consensus and unit labor costs unexpectedly fell. The market sold off the same day. That disconnect, strong fundamental adoption data alongside a violent price break in the adopters, is exactly what October 1927 looked like.
Part IV: Oil, war and the three-month lag
Two oil crises, two different price shocks
Both years carried a geopolitical oil confrontation. What separates them is that one stayed a threat and the other became a war.
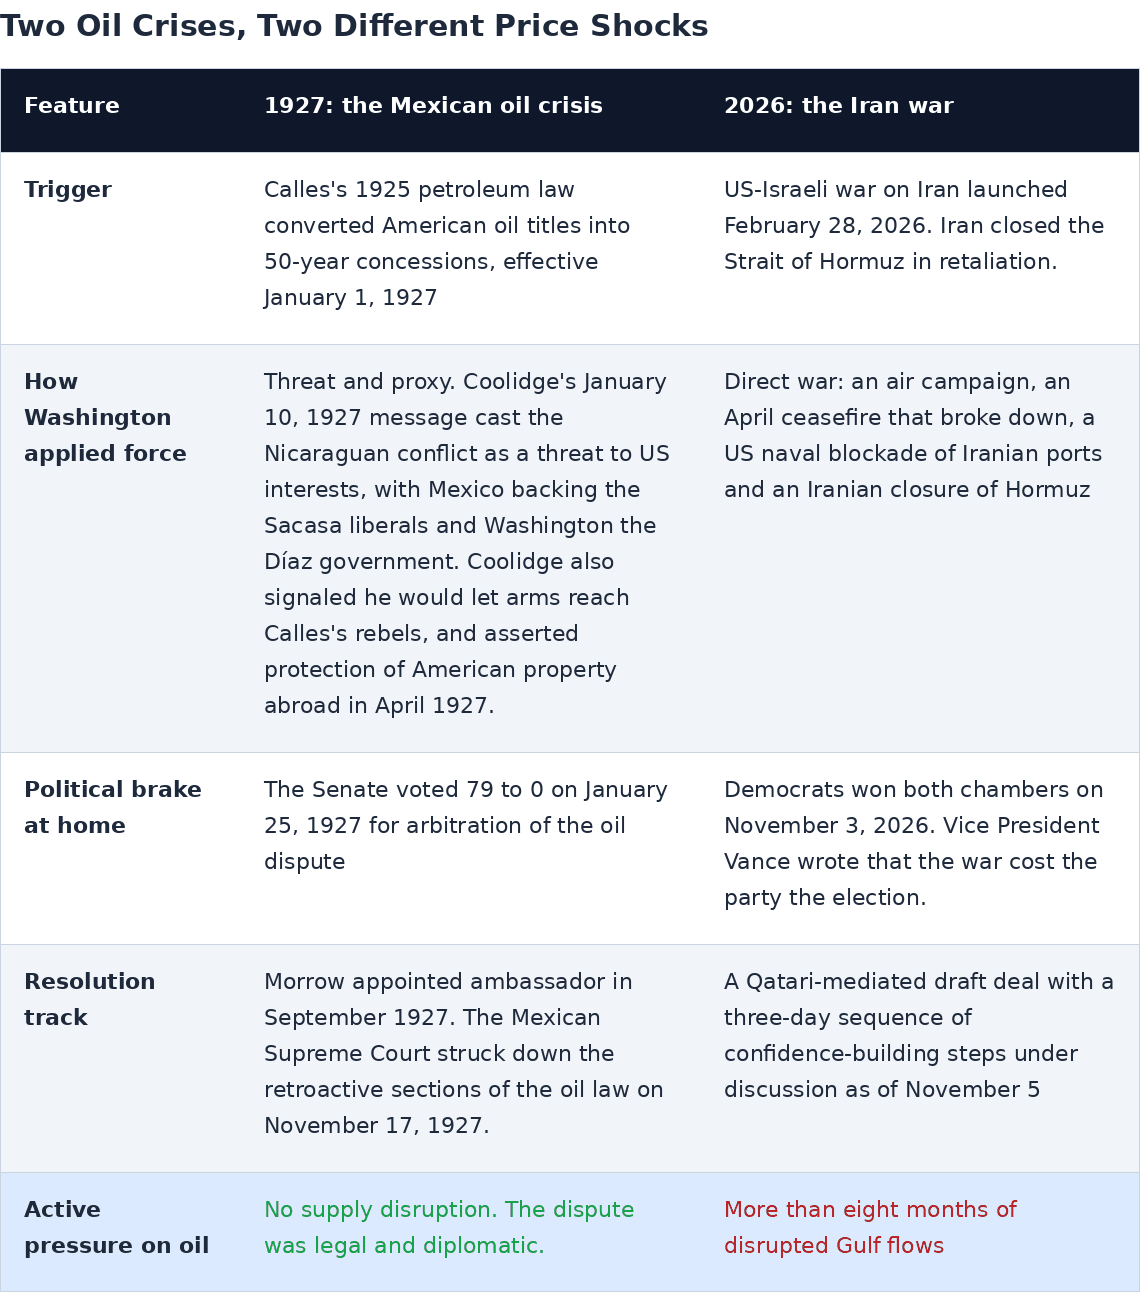
Because Coolidge never had to fight Mexico directly, the 1927 confrontation never removed a barrel from the market. The 2026 war did. Brent's most active contract reached nearly $120 in March, the AP reported, and touched $118 again on October 30 after a tanker strike in Hormuz, The National reported. Vice President Vance wrote that "the reason we lost is the war."
The same supply cushion: rising US output and Venezuelan barrels
The supply side rhymes closely. In both eras, US production kept climbing and Venezuela emerged as the swing supplier to the American market.
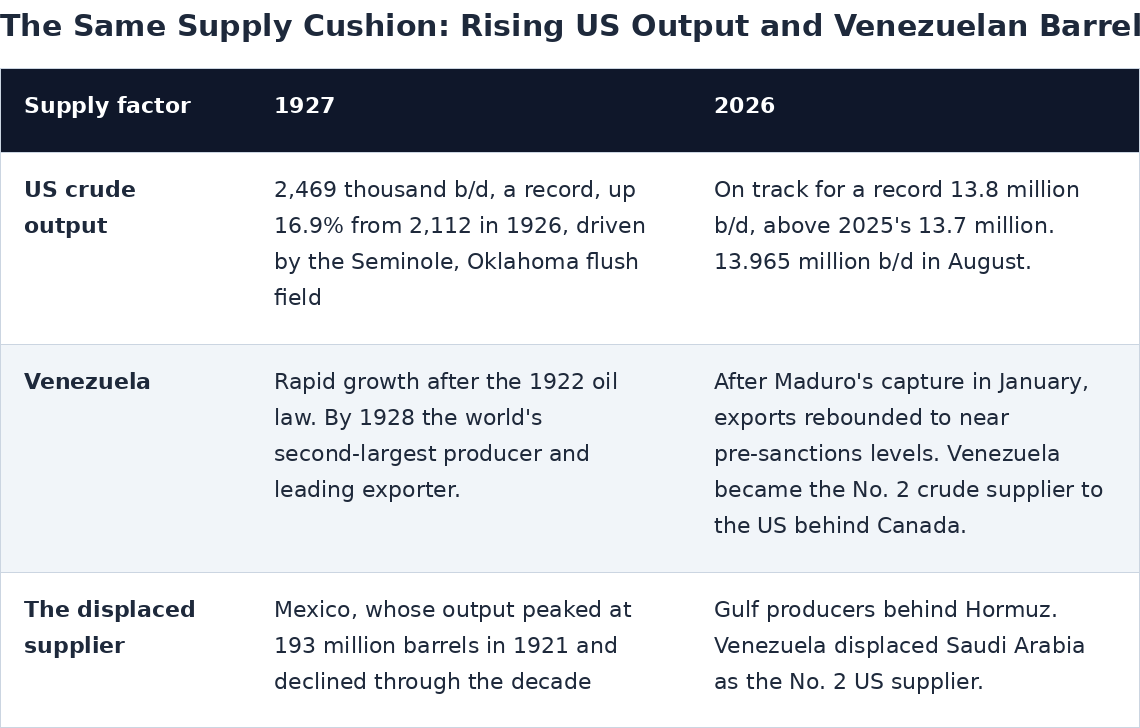
The difference is what happened to price. With no supply lost, the 1927 production surge flowed straight into lower prices: the US crude first-purchase price fell from $1.88 a barrel in 1926 to $1.30 in 1927, a 31 percent drop, on EIA data, and the wholesale petroleum products index fell from 90.9 in February 1927 to 70.0 in April 1927 as Seminole came on. In 2026 the same kind of production cushion was absorbed by a war premium instead of passing through to consumers.
Inflation: early 1927 vs. late 2026
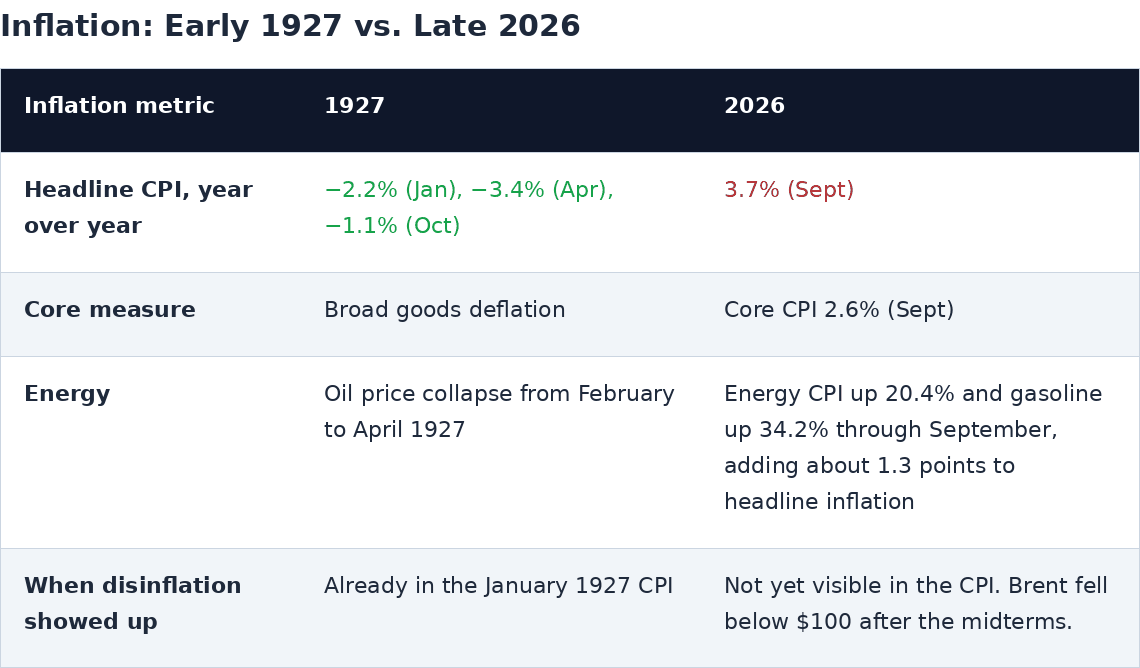
1927 entered the year with deflation already in the data: the CPI had turned negative year over year in mid-1926 and reached minus 2.2 percent by January 1927. Strip energy out of 2026 and the picture is much closer to 1927 than the headline suggests. Nearly all of the rise in inflation since February is the fuel bill, while core sits at 2.6 percent and unit labor costs are falling.
The thesis of this paper is that the length and directness of the Iran war, compared with Coolidge's threat-and-proxy handling of Mexico, pushed the energy-driven disinflation that 1927 enjoyed from early in the year to late 2026, and that this held back the market's melt-up by roughly three months. Two pieces of the evidence are now turning at once.
Oil. Brent fell 8.7 percent to $94.62 after the midterms and was headed for its biggest weekly loss since 2020 on peace hopes, Bloomberg reported, even as Eurasia Group warned that renewed escalation could send it to $110 to $125.
Politics. The midterm result functions as the 2026 equivalent of the Senate's 79-to-0 vote in January 1927: a domestic political brake that pushes the White House toward a negotiated end. Axios reports that Trump has said for weeks he would end the war one way or another after the election.
The near-term inflation data will be noisy. TD Securities expects October headline CPI to slow to 0.30 percent month over month from 0.65 percent in September, while RBC argues the energy spillover into other prices is still arriving. No year-over-year October CPI will be published, because October 2025 data are missing after the government shutdown. The disinflation case therefore rests first on oil prices and productivity, and only later on the CPI itself.
Testing the three-month lag
If 2026 is running three months behind 1927, then 2026's monthly pattern should line up better against 1927 shifted three months earlier, comparing 2026's October with 1927's July, and so on.
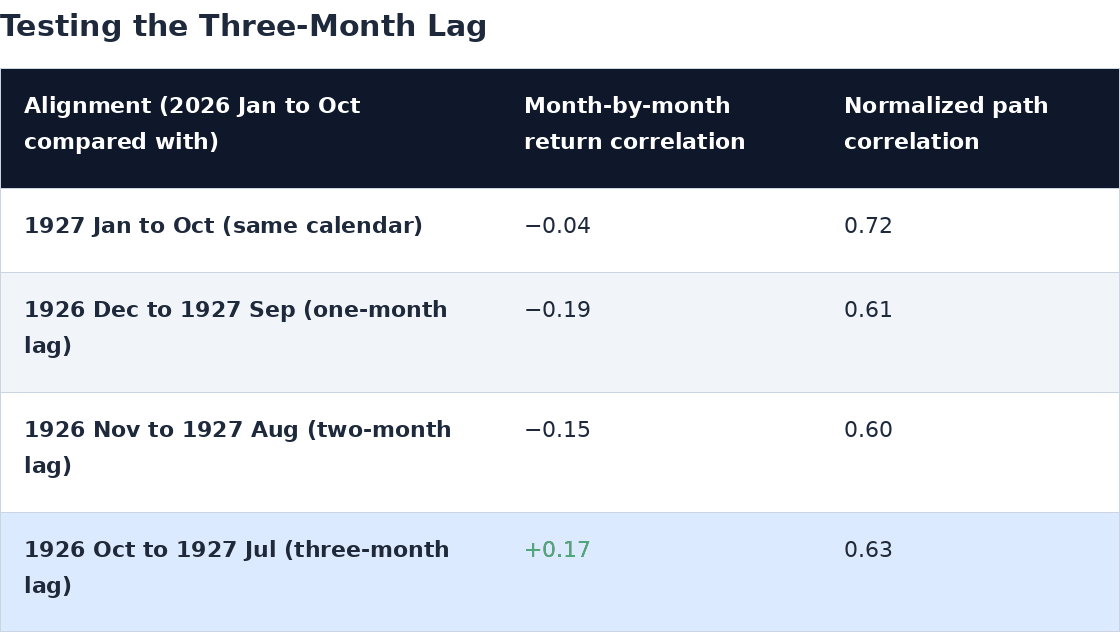
The three-month lag is the only alignment in which the month-to-month moves correlate positively, which supports the timing argument. The overall shape still matches best on the same calendar, and no lag closes the magnitude gap. Read together, the evidence fits a 2026 that has followed 1927's path at a slower and later pace rather than one that has broken from it.
Part V: Bonds and the Fed, the clock running a year early
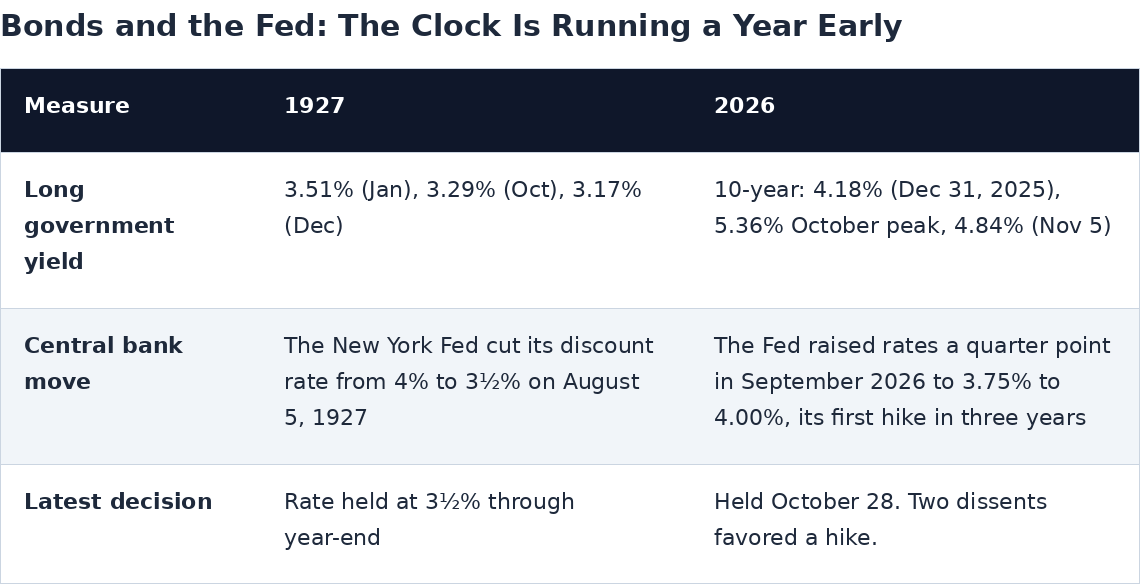
On a strict one-to-one reading, 2026 has broken the 1927 monetary template: yields rose instead of falling, and the Fed tightened instead of easing. But the same data place 2026 squarely in the 1928 template. In 1928 the New York Fed raised its discount rate from 3½ percent to 5 percent between February and August, long yields rose from 3.17 percent to 3.48 percent, and the Dow still gained 48.22 percent. Tightening into a technology boom did not end the 1920s bull market. It made it more volatile.
The bond market is now pointing back toward easing. The 10-year yield has fallen nearly half a point from its October peak and on November 5 posted its lowest close since September 9, while short-end yields fell 12 basis points and the curve bull-steepened during the sell-off, Reuters reported. If oil-driven inflation fades, that is the setup for the late Fed move the thesis calls for: the 2026 version of August 1927, arriving in 2027.
Part VI: Leadership and breadth
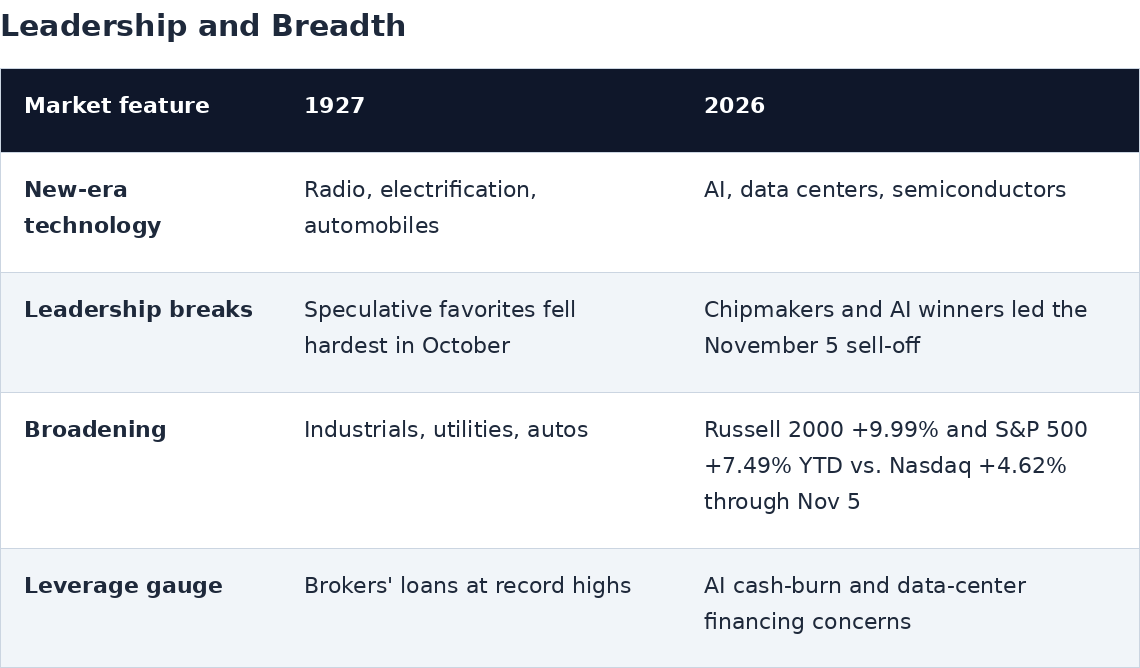
Both years show the same rotation under stress: the narrow leaders of the new technology take the deepest hits while the broader market holds up better. Through November 5, the Dow is 5.2 percent below its August 5 record close of 54,349.12, while the Nasdaq is 11.9 percent below its October 6 record.
Part VII: The projected analog, re-anchored
The original analog path applied the 1927, 1928 and 1929 Dow returns directly to the 2025 year-end close. With 2026 running behind 1927, a second path re-anchors to the actual October 2026 close and applies the same 1927 to 1929 returns from that point.
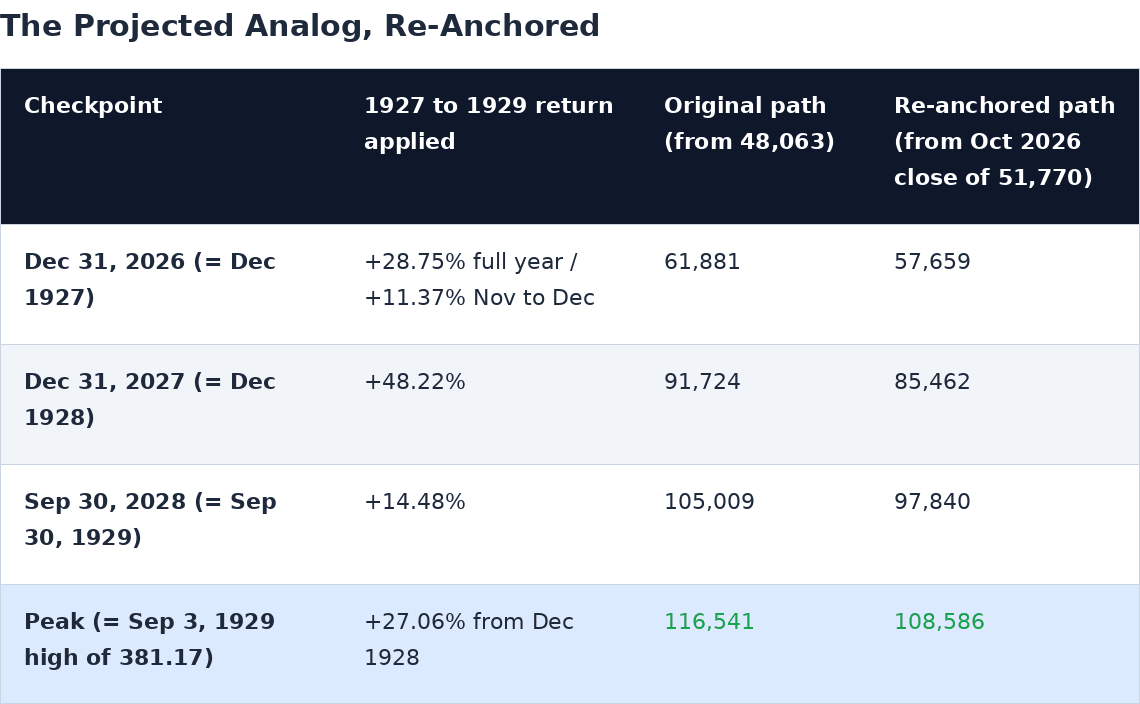
Matching 1927's full-year 28.75 percent would require a further 20.1 percent gain from the November 5 close in less than two months, which is outside the range of the 1927 analog itself: November and December 1927 delivered 11.37 percent. The re-anchored path is the more realistic expression of the same comparison. It accepts that 2026 has done roughly half of 1927's work, and still implies a Dow of about 108,600 at a 2028 peak, roughly double the November 5 close.
The three-month lag path
The alternative reading of the same data is that 2026 is not doing less than 1927, only doing it later. On that reading the original analog levels still apply, each arriving about one quarter behind the 1927 to 1929 calendar.
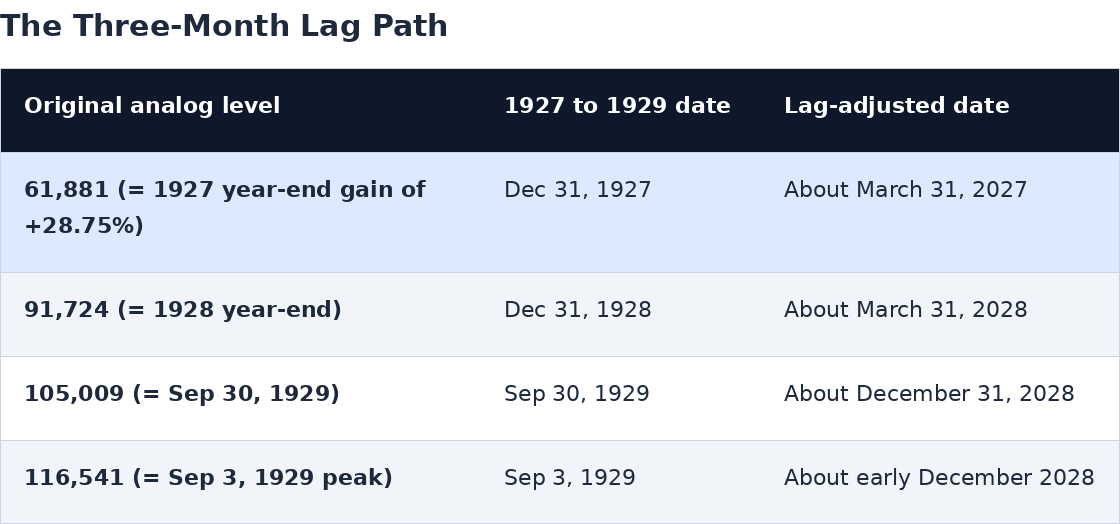
Reaching 61,881 from the November 5 close requires a 20.1 percent gain. That is close to what the 1927 Dow did in its second half: from the June 1927 close of 166.23 to the year-end close of 202.40 it gained 21.8 percent, despite the October break. A catch-up of that size over the next four to five months would put the clock back on its original 1927 levels by the end of the first quarter of 2027. Lower oil, a negotiated end to the war and continued productivity gains would be the triggers.
The volatility roadmap
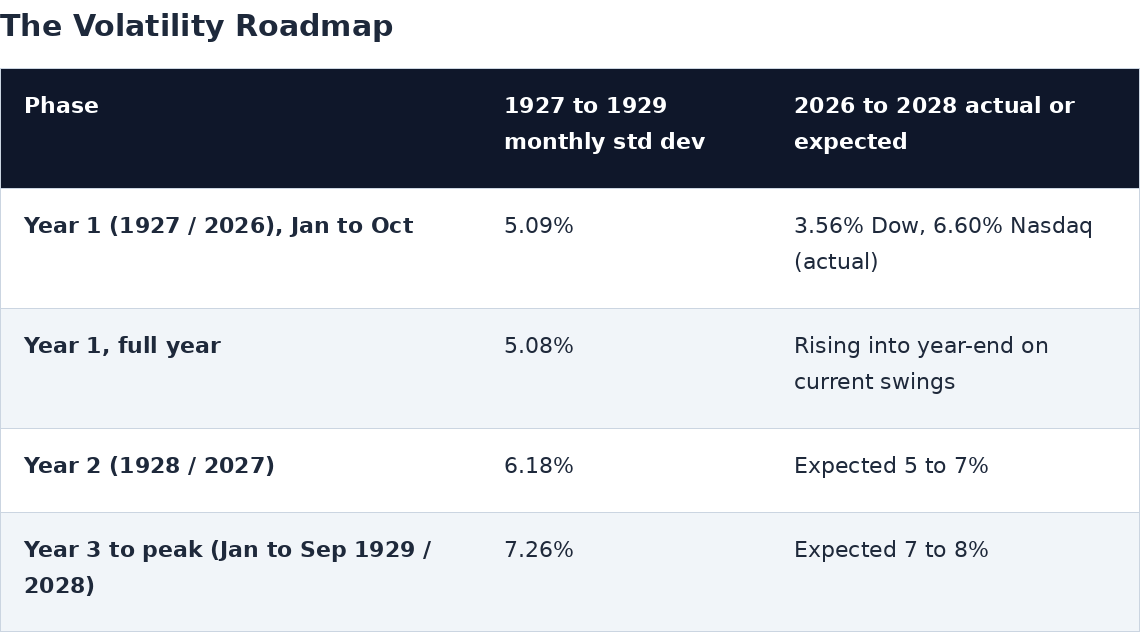
The core insight holds: in 1927 to 1929, every year was more volatile than the one before, and every year was higher. Volatility rose with prices rather than ahead of a decline.
What would break the analog
Oil does not fade. If talks fail and the war escalates again after the midterms, Brent could return to the $110 to $125 band, headline inflation would stay near 4 percent, the Fed would keep hiking, and the 1928-style tightening would become a 1929-style squeeze a year early. The three-month lag would then become a longer one.
Policy turns against the buildout. The November 5 sell-off was explicitly about a new Congress slowing data-center expansion. The 1920s had no equivalent political brake on electrification.
Adoption without returns. October's concern was AI spending that may not pay off. In the 1920s, electrification paid off in measured productivity, and the November 5 productivity report is the first strong sign that 2026 is following suit.
Conclusion: the war delayed the melt-up. It starts now.
Through the close of November 5, 2026, the analog is intact in shape and in its central claim, while running behind on magnitude and ahead on monetary policy.
Volatility. Rising again into the fourth quarter, with the technology-leadership index, the Nasdaq at 6.60 percent monthly, already more volatile than the 1927 Dow at 5.09 percent.
The October rhyme. A record high in the new-technology leaders in early October, a speculative reversal and a sharp autumn break: 1927 and 2026 three days apart on the calendar, 99 years apart in time.
Technology adoption. Faster in 2026 than radio was in the 1920s, and now visible in productivity, up 3.6 percent, and falling unit labor costs.
Oil and inflation. The same supply cushion as 1927, record US output and surging Venezuelan barrels, but an eight-month war rather than a threat-and-proxy standoff kept a premium in oil and pushed energy disinflation from early in the year to late 2026.
Timing. A three-month lag is the only alignment in which 2026's monthly moves correlate positively with 1927's, consistent with a melt-up delayed rather than cancelled.
Fed and bonds. Behaving like 1928, not 1927: tightening into a boom, which in the 1920s raised volatility without ending the advance.
Path. About half of 1927's gain so far. The re-anchored analog points to roughly 108,600 at a 2028 peak. The lag-adjusted path reaches the original 61,881 level around March 2027 and the 116,541 peak around December 2028.
October 1927 looked like the end to many investors at the time. It was a correction inside a technology-driven bull market that had nearly two more years to run. The November 2026 break has the same signature.
The Iran war did not cancel the 1927 analog. It delayed it. A war fought directly, rather than by threat and proxy as Coolidge handled Mexico, kept a premium in oil for eight months and pushed the energy disinflation that 1927 enjoyed early in the year into late 2026. That cost the market about three months, not the call.
The conditions that launched 1927's second-half advance are now in place: a volatility shakeout clearing out the old leadership, productivity up 3.6 percent with unit labor costs falling, oil breaking below $100, and an election that has turned ending the war into a political necessity. The war has only delayed our market melt-up call, and as a result it starts now.
Data notes. Dow Jones Industrial Average month-end closes for 1926 to 1929 and 2025 to 2026 are from the S&P Dow Jones Indices DJA monthly performance report. Nasdaq Composite, Russell 2000, SPY and VIX monthly closes are from Perplexity Finance market data, retrieved November 6, 2026. Lag correlations compare 2026 January to October month-end returns and normalized price paths with 1926 to 1927 windows shifted one to three months earlier. 1926 to 1927 CPI changes are calculated from the not-seasonally-adjusted CPI-U on FRED. Volatility is the sample standard deviation of month-end-to-month-end percentage changes, with annualized figures multiplied by the square root of 12. Correlations compare January to October in each year.
This paper is a historical analog framework, not a forecast guarantee, investment advice or a recommendation to buy or sell any security. The projected paths are arithmetic applications of 1927 to 1929 returns and may not be reached. Figures are drawn from public data and reporting believed reliable but not independently verified.