This Has Happened Before: What the Roaring Twenties Tell Us About the AI Productivity Boom and How It Ends

This is Part Two of a three-part series on agentic AI and the U.S. economy. Part One laid out the macro thesis and the scenario framework — the services-first case for why mainstream forecasts are structurally wrong and what the correct math actually produces. Part Three will translate the thesis into a specific investment playbook with stock picks organized by theme.
I. The Provocation
Here is the most uncomfortable finding to emerge from laying the data side by side: the mainstream consensus on AI's economic impact is predicting a smaller productivity boom than what the United States already delivered under Calvin Coolidge.
Read that again. The forecasts being used to price AI infrastructure investments, calibrate corporate hiring plans, and shape federal policy are, by the standard of the closest available historical benchmark, embarrassingly conservative. Penn Wharton's peak contribution of +0.2 percentage points of annual GDP growth. The White House CEA's mid-range of +1.8% to +4% cumulative over a decade. These numbers do not represent bold thinking about a transformative technology. They represent a productivity outcome weaker than what electrification and the internal combustion engine produced for the American economy between 1923 and 1929, applied to a sector base more than twice as large.
The reason is the wrong analog. For years, commentators reaching for historical comparisons have invoked the 1990s internet boom, the PC revolution, or the post-WWII manufacturing surge. These are not the right benchmarks. The right benchmark is the Roaring Twenties, specifically the seven-year run from 1923 to 1929 when a general-purpose technology transformed the dominant productive sector of the American economy within a single decade.
The parallels between that period and our own are striking enough to be instructive. The differences are more important, and one of them should concern every investor who owns the AI upside without thinking carefully about the structure being built on top of it. The 1920s boom, remember, did not end gracefully.
II. What Actually Happened: The 1923–29 Baseline
Economic historians have a name for what happens when a general-purpose technology, one capable of transforming production methods across multiple industries simultaneously, reaches critical mass in an economy. They call it a productivity regime shift. The electrification of American manufacturing, combined with the proliferation of the internal combustion engine, is the gold-standard case study of exactly that phenomenon.
The numbers from the 1923 to 1929 period are worth dwelling on, because they tend to be remembered in vague terms, "the Roaring Twenties," a bull market, prosperity without the specificity that makes them useful as a benchmark.
Real GDP grew at approximately 3.4% annually from 1920 to 1929, with labor productivity growing at 2.4% per year over the same period. Per-capita output expanded at more than 3.3% annually after the sharp 1920–21 recession, roughly 1.5 percentage points above the 20th-century average. Output per labor-hour grew at 3.5% per year from 1919 to 1937, compared to just 1.2% in the prior twenty years, a near-tripling of the productivity growth rate. Capital productivity, which had been running at negative 1.8% annually before 1919, flipped to positive 3.1% annually after. Industrial production grew 70% between 1922 and 1928. Real wages for employed workers rose 22% over the same six-year period. Unemployment fell from 5.5% to 3.2% under Coolidge. Total factor productivity grew at 1.7% annually through the 1920s, a figure that, in Robert Gordon's own assessment, was well ahead of anything the U.S. economy had achieved in the prior four decades or would achieve in the four decades that followed.
The diffusion curve of the underlying technology is equally instructive. In 1914, approximately 30% of American manufacturing ran on electricity. By 1929, that figure had reached 70%. The S-curve of adoption for a general-purpose technology transforming the dominant productive sector took roughly fifteen years to mature from early adoption to near-saturation.
Gordon's long-run productivity data puts the 1920s boom in its proper context. U.S. productivity averaged approximately 3% per year from 1920 to 1970, the long postwar boom that followed the electrification era. It dropped to 1.5% in the 1970s and 1980s. It briefly recovered to 2.5% to 3% during the 1995 to 2005 IT boom. And it has been stuck at approximately 1% since 2005. The pre-AI run rate entering the 2020s was 1.0% to 1.5%, which was the weakest sustained productivity performance in the modern data history of the American economy.
That is the baseline from which agentic AI lifts off. A productivity floor of 1% to 1.5%, against a historical peak, the electrification era, of 3% sustained for fifty years. The distance between those two numbers is the opportunity. The mechanism that closes it is what we modeled in Part One.
III. The Side-by-Side: 1920s vs. Our Scenarios
Placing the 1923–29 actuals next to our three AI scenarios produces a comparison that is worth reading carefully, because each row tells a different part of the story.
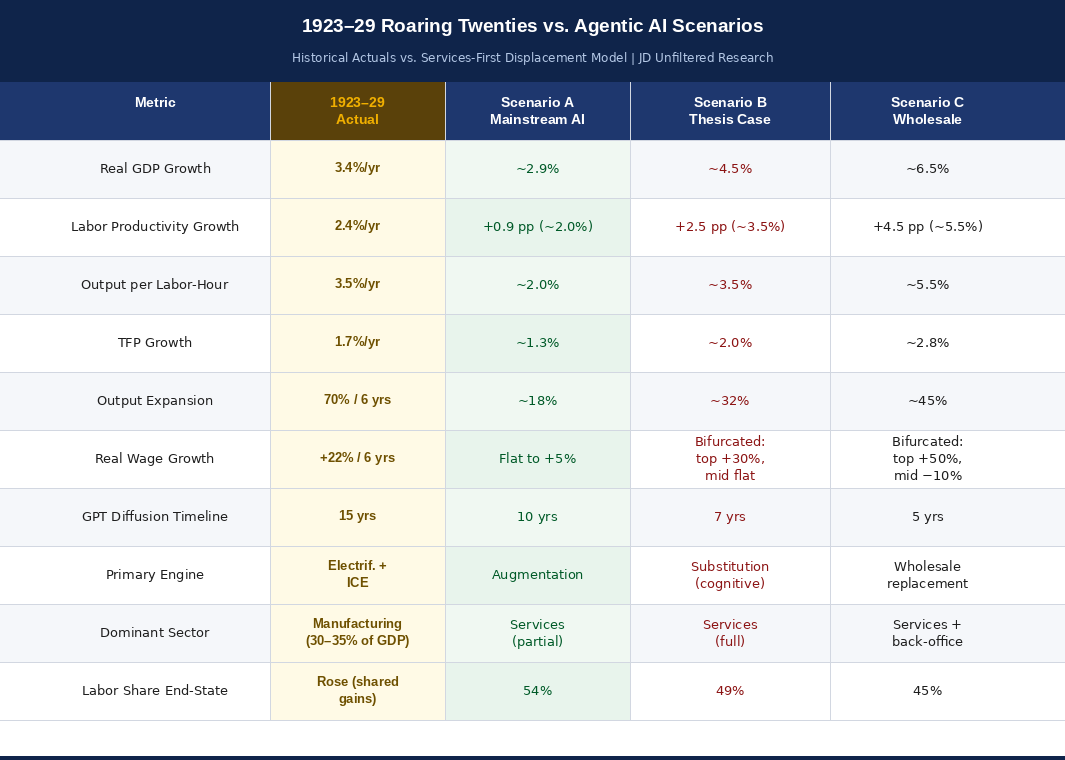
Start with real GDP growth. The 1920s delivered 3.4% annually for the decade, a figure that, at the time, represented the fastest sustained growth the American economy had ever produced outside of wartime. Scenario A, our conservative mainstream case, implies approximately 2.9% sustained real GDP growth. Scenario A – the floor of our range, is already broadly comparable to the Roaring Twenties growth rate, and it is the scenario that most closely resembles the published consensus forecasts that are supposedly modeling a transformative technology. The consensus is predicting a productivity boom roughly equivalent to the weakest version of what electrification delivered.
Scenario B — our central thesis case, 40% displacement of cognitive services labor over seven years, implies approximately 4.5% sustained real GDP growth. This exceeds the 1920s growth rate and does so applied to a services base that is 2.3 times larger as a share of GDP than the manufacturing base that electrification transformed. In absolute dollar terms, the productivity gain is not comparable to the 1920s. It dwarfs it by a factor of 100 to 150 in nominal terms, even before adjusting for a century of real economic growth.
Scenario C — 55% displacement over five years, implies 6% to 7% real GDP growth sustained for half a decade. The United States has not produced those growth rates since the immediate postwar reconstruction period of 1946 to 1952. If Scenario C materializes, it represents the single largest productivity shock in the recorded history of the American economy, in absolute dollar terms, by a wide margin.
The TFP comparison is equally clarifying. The 1920s produced total factor productivity growth of 1.7% annually, the benchmark against which Gordon measures every subsequent technology cycle. Scenario B implies TFP growth of approximately 2.0%. Scenario C implies 2.8%. The AI thesis, in its central case, is a bet that agentic AI outperforms electrification on the TFP dimension, not marginally, but meaningfully applied to an economy that is nearly nine times larger in real terms.
The output expansion row tells perhaps the starkest story. Industrial production grew 70% from 1922 to 1928, the visual symbol of the Roaring Twenties prosperity. Scenario B implies approximately 32% output expansion over its seven-year horizon. Scenario C implies 45% over five years. The pace of Scenario C is faster than the electrification era. The scale is incomparably larger.
One comparison in the table cuts against the optimism, and it is the most important one. Real wages for employed workers grew 22% from 1922 to 1928. In our Scenario B, wages bifurcate: the top quintile of credentialed professionals who successfully navigate the transition sees real wage growth of 30% or more. The middle two quintiles see wages flat to marginally positive. In Scenario C, the bifurcation is violent — top earners up 50% or more, the middle quintiles down 10%. There is no scenario in our framework that replicates the broadly shared wage gains of the 1920s. That is not a modeling choice. It is the structural consequence of the most important difference between then and now.
IV. Three Critical Differences and Where the Analog Breaks Down
The 1920s comparison is not a reassurance. It is a warning. The three ways today's shock diverges from the historical case are more important than the parallels, and each one carries specific implications for how this transition plays out.
Difference One: The 1920s benefits were broadly shared. Ours won't be.
The mechanism of the electrification productivity boom was augmentation. A factory hand operating an electric drill press was more productive than one operating a steam-powered press, and he was still needed. The technology made the existing worker more valuable. Wages rose. Unemployment fell to 3.2%. Labor share of GDP actually increased during the Roaring Twenties because the technology amplified human labor rather than displacing it.
Agentic AI operates through substitution. Not augmentation at the margin, wholesale replacement of the cognitive labor input. The $300-per-month agent that handles the research, the drafting, the analysis, and the first-pass review does not make the junior analyst more productive. It makes the junior analyst unnecessary. The role is not enhanced. It is vacated.
The implication for labor's share of national income is the mirror image of the 1920s experience. In Part One, we modeled labor share falling from 56% of GDP today to 54% in Scenario A, 49% in Scenario B, and 45% in Scenario C. The 1920s moved in the opposite direction, as labor share rose as workers captured a portion of the productivity gains their enhanced output produced. In our framework, there is no mechanism by which that happens. The productivity gains flow directly and almost entirely to capital. This is not a distributional nuance at the edges of a broadly positive story. It is a structural inversion of the feature that made the 1920s boom broadly beneficial.
The political consequences of that inversion are not speculative. The White House CEA used the phrase "great divergence" in its January 2026 report to describe the widening gap between AI-capable and AI-displaced workers. The phrase is borrowed from the inequality literature, and its use by the Executive Office of the President is a signal that the distributional consequences of agentic AI are already visible enough to require political framing. What happens when those consequences are fully visible, when the labor share numbers are in the data, not just in the models, is the second-order story that investors are not pricing.
Difference Two: The 1920s diffusion was fifteen years. Ours is five to seven.
Electricity moved from 30% to 70% of American manufacturing between 1914 and 1929 — a fifteen-year diffusion curve. That span is not incidental. It represents the time it took for capital equipment to be retooled, for workers to be retrained on new machinery, for management practices to adapt to electric-powered production, and for the broader economy to begin building the infrastructure, educational, institutional and contractual that would allow the productivity gains to diffuse more broadly through the workforce.
Fifteen years is two full presidential terms. It is long enough for a cohort of workers to complete a retraining program. It is long enough for a new generation of students to enter the workforce with skills calibrated to the new production paradigm. It is long enough, in short, for the economy to begin absorbing the shock through normal mechanisms of labor market adjustment before the full weight of displacement is felt.
Agentic AI enterprise adoption is running on a three to five year curve. The technology is not waiting for capital equipment retooling cycles or curriculum redesign committees. It deploys through software. Its marginal cost of replication is near zero. Early-adopting firms are already reporting the results that accelerate adoption among laggards. The diffusion S-curve that took electricity fifteen years to trace is, by every available measure, compressing toward five to seven for agentic AI.
That compression is the single variable that makes the human stakes of this transition qualitatively different from the electrification era. The adjustment mechanisms that eventually, imperfectly, partially, over decades made the 1920s productivity shock broadly beneficial required time that we do not have. The speed is not a feature of the technology's strength. It is the central risk of the transition.
Difference Three: The 1920s boom ended in 1929. Ours might too.
This is the one that investors most need to sit with.
The Roaring Twenties productivity and capital-formation boom was accompanied by a specific financial and distributional architecture: rising asset concentration, declining labor share in industrial sectors, aggressive margin financing, and a stock market that by 1929 was pricing in permanent high growth as a base case. The equity bull market of the 1920s was not irrational in the sense of being disconnected from real economic performance, the real performance was extraordinary. It was irrational in the sense of extrapolating extraordinary performance indefinitely and financing that extrapolation with leverage.
By 1929, the productivity gains had not stopped. This is the fact that most popular accounts of the Depression get wrong. Economic historian Alexander Field, in meticulous analysis of the interwar period, documented that total factor productivity continued growing at 1.9% per year through the Depression decade — making the 1930s, by TFP measures, the most technologically progressive decade of the entire 20th century. Electrification did not fail. The assembly line did not stop working. The internal combustion engine did not lose its productivity properties.
What failed was the financial and demand-side structure that had been built on top of the productivity boom. Collapsing labor share meant that the productivity gains were not being recycled into consumer purchasing power at the rate required to clear the output the economy was producing. Concentrated capital gains meant that the wealth being created was accumulating in financial assets rather than flowing into wages and consumption. Margin financing meant that asset prices were being sustained by leverage that could not survive a confidence shock. When the confidence shock came in October 1929, the productivity story was irrelevant — the financial architecture had become too fragile to bear the weight of the distributional consequences it had created.
The parallel to today is precise enough to be disquieting. Capital is capturing the gains from agentic AI. Labor share is falling. Asset prices are pricing in permanent high growth. Leverage is expanding against AI-related equity positions. The productivity story may be entirely correct, as Scenario B or C may play out exactly as modeled, and the financial and political structure built on top of it may still fail under the weight of its own distributional fragility. Productivity does not immunize a financial system against the consequences of concentrating its gains too narrowly, too fast.
We are not predicting a crash. We are pointing out that the last time this specific combination of features, transformative general-purpose technology, rapid productivity gains, capital-concentrated distribution, compressed timeline, occurred in the American economy, it ended with the most severe financial crisis in modern history. That history is a constraint on the optimism, not a refutation of the thesis.
V. The Framing That Changes the Investment Thesis
The 1920s comparison is not merely a rhetorical device to make the AI thesis legible. It does three specific things to how investors should think about positioning for this transition.
First, it provides a credible productivity benchmark grounded in observed historical data rather than model projections. The question is no longer whether an AI-driven productivity boom is plausible, it is which decade of 20th-century American history provides the right calibration. The 1920s delivered 3.4% real GDP growth for seven years by transforming 30–35% of the economy. Agentic AI is hitting 77.6% of the economy. The benchmark makes the thesis not just credible but, if anything, still conservative in its central case.
Second, it forces a reckoning with scale. The 1920s electrification boom produced a 2.4% annual labor productivity gain applied to roughly $103 billion of 1929 GDP, primarily in the manufacturing sector. Scenario B applies a similar productivity gain to a services base of approximately $23 trillion today. The absolute dollar magnitude of the productivity gain is roughly 100 to 150 times larger in nominal terms. There is no prior technology cycle in the experience of living investors that provides useful intuition for numbers at this scale. The 1990s IT boom, the largest productivity surge of the past thirty years, produced sustained GDP growth of approximately 3% for a decade and it is, in our framework, the lower bound of what Scenario B implies.
Third, and most importantly, the historical frame makes the fragility risk explicit and investable rather than vague and deniable. The 1929 crash happened not because the technology failed but because the adjustment infrastructure, the mechanisms by which productivity gains are distributed broadly enough to sustain consumer demand and political legitimacy, was never built. Investors who understand this can identify and own the assets that function as adjustment infrastructure: credentialing platforms, rate-sensitive duration instruments that benefit from services deflation, policy advisory businesses, commercial real estate conversion vehicles. These are not defensive hedges against the AI thesis. They are the second-order investment thesis that flows directly from understanding how the 1920s actually ended.
The investor who owns only the primary productivity wave, namely the AI infrastructure, services-margin expansion, tech equity multiples, is replicating the portfolio of a well-informed American investor in 1927. Right on the thesis, underexposed to the structure. The complete trade requires both.
VI. The Takeaway and What Comes Next
The late 1920s analog is the right historical benchmark for agentic AI. It is right on the mechanism, a general-purpose technology transforming the dominant productive sector of the economy. It is right on the magnitude, the GDP and TFP outcomes are in the same range as our central scenario, applied to a base more than twice as large. And it is right on the warning, the features that eventually broke the 1920s boom are present in today's transition in more concentrated form, on a shorter timeline.
The honest summary of what the historical comparison tells us: expect the AI productivity shock to be bigger than the 1920s in absolute magnitude, faster in its diffusion, and more concentrated on capital in its distribution. That combination is simultaneously the most compelling macro investment opportunity of the current generation and the most significant source of financial and political fragility since the interwar period.
Positioning for only one of those is an incomplete trade.
Part Three translates this map into specific positions. The historical record tells us what happens when a general-purpose technology transforms the dominant sector of an economy, who wins first, who wins second, and what eventually breaks. The investment playbook that follows from that record is specific, differentiated, and in several cases counterintuitive. That is where we go next.
The author holds positions in securities discussed and reserves the right to buy or sell shares at any time without notice. This article is for informational and educational purposes only and does not constitute investment advice. Past performance is not indicative of future results.