The $9 Trillion Blind Spot: Why Every AI Forecast You've Read Is Wrong


This is the first installment in a three-part series on agentic AI and the U.S. economy. Part One lays out the macro thesis and the data behind it. Part Two examines the closest historical analog, the Roaring Twenties productivity boom of 1923 to 1929, and what it tells us about how this ends. Part Three translates the thesis into a specific investment playbook with stock picks organized by theme.
I. The Problem With the Consensus
Let's start with what the experts are telling you.
Penn Wharton's Budget Model projects AI will raise U.S. GDP by 1.5% by 2035 and contribute a peak of +0.2 percentage points of annual growth in 2032, before fading. The White House Council of Economic Advisers cites a mid-range estimate of +1.8% to +4% GDP gains tied to AI adoption over the coming decade. PwC forecasts AI adds roughly one percentage point of annual global growth, on par with 19th-century industrialization. Goldman Sachs, the most aggressive of the major houses, puts the cumulative productivity gain at 15% over ten years.
These are the numbers being fed into portfolio models, policy frameworks, and corporate planning decks across Wall Street and Washington. They are, we believe, wrong — not at the margins but structurally. Not because the authors lack rigor, but because they are modeling the wrong technology.
Every major AI forecast published to date was calibrated on a world where a human still had to prompt every step. Where AI was a tool that made workers faster, not a system that replaced the worker entirely. That world ended when agentic AI arrived. And the forecasters haven't caught up.
The core error is a single assumption: augmentation versus substitution. Wharton models labor cost savings of 25% maturing to 40% — inside a framework where the employee stays. That is the augmentation model. What is actually being deployed in enterprise environments today is categorically different: a $300-per-month AI agent that replaces the role entirely. Not 25% faster. Gone. The numerator stays constant. The denominator collapses. The math that follows is a different calculation altogether.
Run it correctly and the numbers are not just larger. They are jaw-dropping. We are looking at the largest productivity shock in U.S. economic history — and almost no one has priced it.
II. Why Services Change Everything
Before the scenarios, a foundation that almost every AI forecast paper buries in a footnote — or ignores entirely.
Three numbers anchor the entire argument:
Services represent 77.6% of U.S. GDP — approximately $23.4 trillion of a roughly $30 trillion economy. Services employ 72% of the U.S. workforce. And labor compensation accounts for approximately 56% of GDP, meaning broad compression of services labor costs flows through to GDP productivity gains at nearly a one-to-one ratio.
This is why the historical comparisons analysts reflexively reach for — the internet boom of the 1990s, the IT productivity surge of 1995 to 2005 — are inadequate benchmarks. Those shocks were real, but they operated primarily on manufacturing and goods-processing industries that represented a shrinking share of the economy. The 1990s tech boom turbocharged a sector that was already losing ground to services as a share of GDP.
Agentic AI is different in the most fundamental way possible: it is aimed squarely at the dominant sector of the modern economy. The 30 to 35% of GDP that was manufacturing in the 1920s, when electrification transformed it, looked enormous at the time. Services at 77.6% of GDP today is more than twice that base. Any model that doesn't start here is modeling the wrong economy.
There is also an export dimension that the major forecast houses consistently underweight. U.S. services exports exceeded $2 trillion annually even before the agentic AI wave. American firms deploying agent stacks against foreign service markets — legal, financial, consulting, research — capture margin internationally on top of domestic productivity gains. The implication is that GNP grows faster than GDP as the transition matures, because U.S. firms are not just cutting domestic costs; they are expanding the addressable market for American cognitive output globally. None of the major models price this in with any rigor.
The starting point, then: any honest analysis of agentic AI's economic impact must begin with the recognition that the addressable base is not the whole economy at some blended average — it is the $23.4 trillion services sector, of which roughly $9.2 trillion is cognitive services labor directly in the crosshairs.
III. Why the Mainstream Forecasts Are Wrong
The prosecution of consensus deserves its own section because the failure modes are specific, identifiable, and instructive. There are three.
Failure One: They model augmentation, not substitution.
The Wharton model, the most technically rigorous of the published frameworks, assumes labor cost savings of 25% at adoption, rising to 40% at maturity. These are the parameters for a world where AI makes the existing employee more productive. That is augmentation. What enterprise deployments are actually documenting is something else: entire roles being vacated and replaced by agent workflows at a fraction of the cost.
A mid-level financial analyst producing sector research reports at $150,000 a year in salary and benefits is not being replaced by a slightly-faster analyst. The analyst is being replaced by an agentic workflow that ingests filings, synthesizes earnings calls, runs comparable company analysis, and produces a publishable draft — for the cost of a software subscription. That is not a 40% labor cost savings. That is a 95% labor cost savings on that function, with the remaining cost being the one senior professional who reviews and publishes.
When substitution replaces augmentation as the operative assumption, the GDP math doesn't shift a little. It shifts completely.
Failure Two: They use pre-agentic diffusion curves.
The forecast models published by Penn Wharton, the CEA, and PwC were built before agentic AI systems, systems capable of autonomous multi-step reasoning, tool use, and self-correction, achieved real enterprise deployment at scale. They are, in a meaningful sense, forecasting the wrong technology.
Agentic systems compound in ways that single-model assistants do not. One decision-maker triggering an agent workflow now replaces chains of work that previously required junior analysts, paralegals, or associates at every step. The enterprise data already visible in the market reflects this: multi-agent deployments are showing 34.2% improvement in resource utilization, 13.6% reduction in task completion time, and 7.7% gains in output accuracy. Independent reviews of deployed workflows in customer service, software development, consulting, writing, and financial analysis document productivity gains of 14% to 34%, and those are early-cycle numbers from systems that are improving rapidly.
The diffusion curves in the published models assume gradual enterprise adoption paced by change management, regulatory friction, and workforce resistance. What is actually happening is that early adopters are reporting results that are compelling enough to accelerate adoption among laggards. The curve is steeper than the models assume.
Failure Three: They ignore the services export multiplier.
U.S. firms are not just deploying AI domestically. They are building agent infrastructure that can deliver American cognitive services — legal analysis, financial research, management consulting, engineering review — to foreign buyers at a fraction of the historical cost. Every percentage point of U.S. services productivity gained domestically is amplified globally as American firms expand their addressable market.
This is the GNP gap that the major forecasters miss: GDP measures domestic output, but GNP captures what American firms earn abroad. As AI-enabled American service firms penetrate foreign markets at lower delivered cost, GNP expands faster than GDP. The Wharton model nods at a "+0.04 pp permanent growth" bonus from sectoral shift — a footnote that dramatically understates the export dimension.
The result of these three compounding errors is a forecast consensus that is not merely conservative. It is modeling a technology that no longer exists at a pace that the actual data has already exceeded.
IV. The Three Scenarios
The framework we present is built from the cognitive labor pool up — a services-first model rather than a top-down GDP model with AI adjustments layered on. The starting point is the $9.2 trillion in cognitive services labor directly exposed to agentic substitution. Three scenarios bound the range of outcomes.
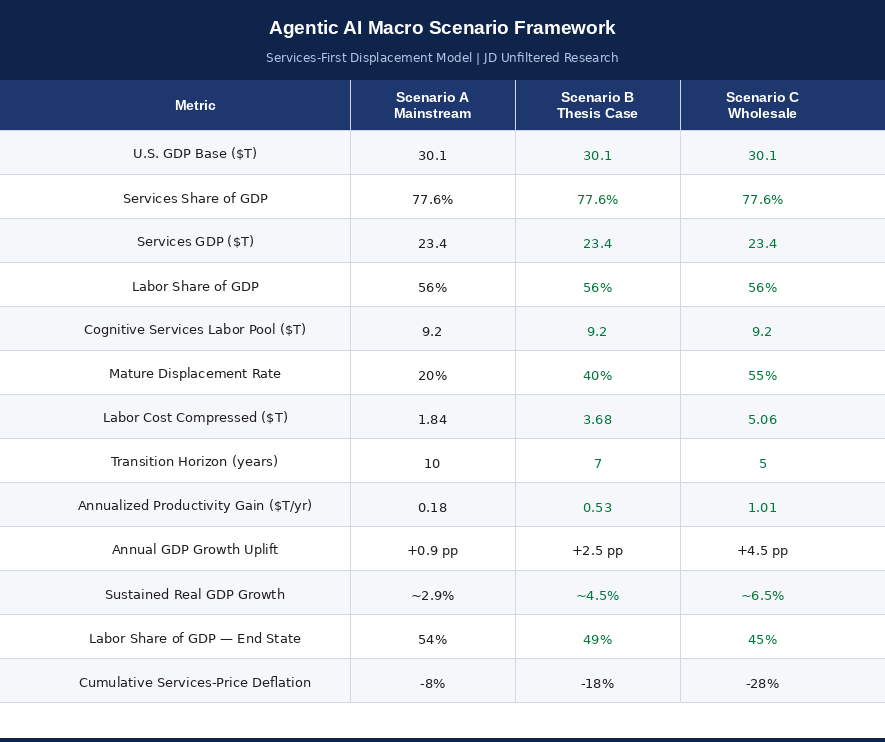
Scenario A — The Mainstream Case (20% displacement, 10-year horizon)
This is the augmentation case — the world the published forecasts are modeling. Twenty percent of cognitive services labor is displaced or reallocated over a decade. Even here, running the services-first math rather than a top-down GDP adjustment, the implied GDP growth uplift is +0.9 percentage points annually — nearly quadruple the Wharton headline number of +0.2 pp. Scenario A is the floor, and it is already dramatically more bullish than the consensus on pure arithmetic grounds.
Scenario B — The Thesis Case (40% displacement, 7-year horizon)
This is the substitution case — the world that enterprise deployment data is pointing toward. Forty percent of cognitive services labor displaced or leveraged over seven years, consistent with Wharton's own mature-range labor cost savings assumptions when applied to a substitution rather than augmentation framework. The result: U.S. real GDP growth sustaining at approximately 4.5% annually — roughly double the trend rate of the 2015 to 2025 decade. This is our central case. It is aggressive but internally consistent with what the early enterprise data is already showing.
Scenario C — The Wholesale Replacement Case (55% displacement, 5-year horizon)
The case where agent capability, enterprise adoption rates, and regulatory permissiveness all move faster than consensus — which, at this moment, they are. Fifty-five percent of cognitive services labor replaced or restructured over five years. The implied GDP growth rate: 6% to 7% annually for half a decade. The United States has not sustained growth at those rates since the immediate postwar reconstruction period. This is not a baseline prediction. It is a credible outer bound — and the fact that it is credible is itself significant.
The critical observation across all three scenarios: even the conservative case, Scenario A, implies a productivity shock larger than what standard forecasting models are projecting. The range of outcomes runs from "dramatically underpriced" to "the largest productivity event in U.S. economic history." There is no scenario in the services-first framework where the mainstream forecasts are correct.
V. The Vertical Displacement Pool — Where the $9 Trillion Lives
Abstract numbers become real when you trace them to sectors, roles, and dollar amounts. The total cognitive services labor pool exposed to agentic substitution is approximately $6.9 trillion across 20 verticals. Under Scenario B, $3.0 trillion of that pool is displaced or restructured. Under Scenario C, $4.0 trillion.
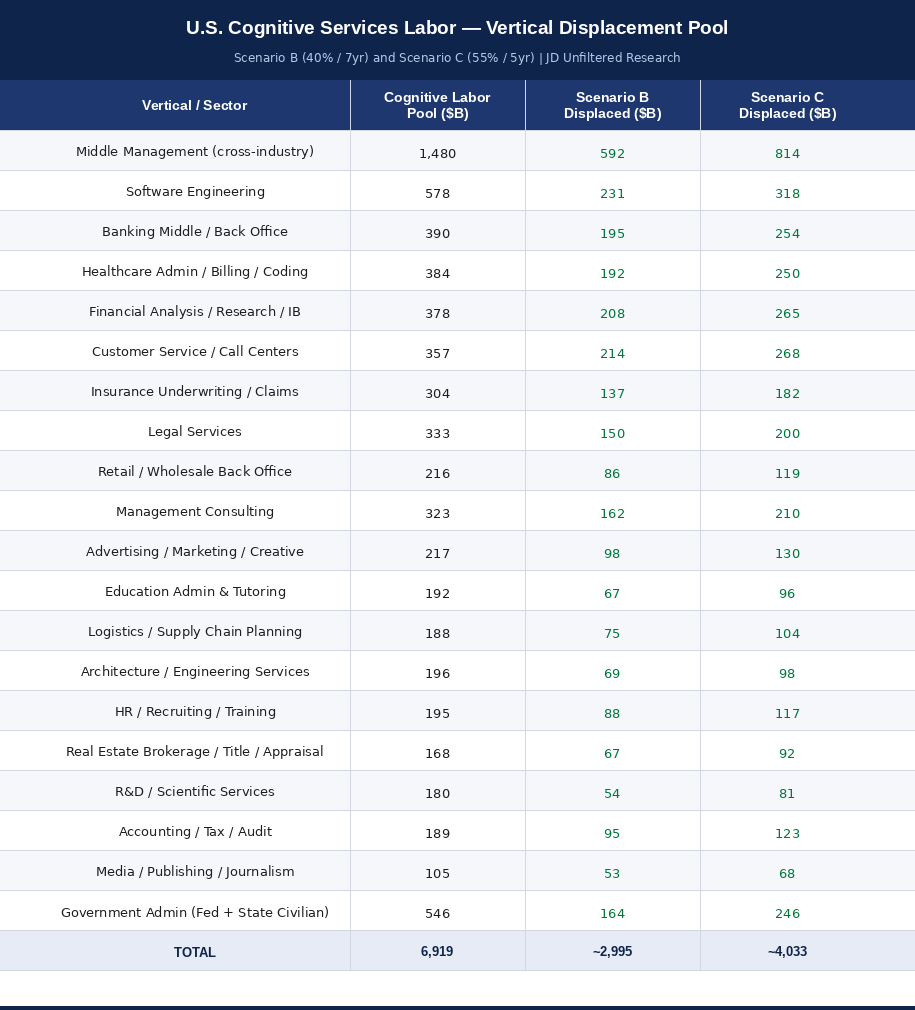
The concentration is striking. Three verticals alone — middle management, software engineering, and banking middle and back office — account for over $1 trillion of Scenario B displacement. Each deserves brief treatment because each tells a different part of the story.
Middle Management ($1.48T pool, $592B displaced in Scenario B) is the broadest and most politically charged category. Middle management exists primarily to coordinate information flows, monitor execution, and translate strategy into task-level direction. Agentic systems do all three. The 45% of organizations with extensive agentic AI adoption that expect to eliminate middle-management layers are not making a speculative bet — they are reporting current intentions based on current deployments. This is the category that will drive the political response when it becomes impossible to ignore.
Software Engineering ($578B pool, $231B displaced) is the canary. It is the most visibly disrupted category precisely because software engineers were among the earliest to adopt AI coding assistants — and among the first to discover that adoption accelerated the case for reducing headcount rather than expanding it. The productivity gains in software development are well-documented and large enough that the industry is already restructuring. What is happening in software in 2025 and 2026 will happen in legal, financial analysis, and consulting in 2027 and 2028.
Banking Middle and Back Office ($390B pool, $195B displaced) is the least publicly discussed but arguably the fastest-moving in terms of enterprise adoption. Banks have enormous incentives to automate compliance, reconciliation, credit analysis, and reporting functions — and they have the IT infrastructure to deploy agent workflows at scale. The displacement here is largely invisible to the public because it happens inside institutions, not in the form of visible layoffs in high-profile roles.
Financial Analysis, Research, and Investment Banking ($378B pool, $208B displaced) is directly relevant to the JD Unfiltered readership. Sell-side research, where a single analyst covering a sector produces reports that were once the work of a team, is already being compressed. The $300-per-month agent that reads every 10-K, synthesizes every earnings call, and produces a publishable comparable company analysis is not a future threat to this category. It is a present one.
Legal Services ($333B pool, $150B displaced) is furthest along the regulatory reckoning. Bar associations and state licensing boards are actively debating what constitutes unauthorized practice of law by an AI system — which means the industry is already past the point of asking whether disruption is coming and is now arguing about the pace of permissible change. The displacement in legal will be partially buffered by regulatory gatekeeping, which is why we see it in the middle of the vertical rankings rather than at the top.
Management Consulting ($323B pool, $162B displaced) is the category most in denial. The major consulting firms are simultaneously the most aggressive deployers of AI tools internally and the most reluctant to publicly acknowledge the implications for their own headcount models. The business model of billing hundreds of hours of junior associate time for work that agent workflows are already performing is structurally impaired. The firms that survive will look more like small senior partner practices with agent leverage than the pyramid structures that dominated the industry for the past five decades.
The remaining fourteen verticals — from healthcare administration to government civilian functions to media and publishing — add another $4.5 trillion to the exposed pool. The depth and breadth of this displacement is what separates agentic AI from every prior technology shock: there is no large sector of the service economy that is not in scope.
VI. What This Does to the Economy
Four macro consequences follow from the scenario framework. Each is significant on its own. Together they describe a macro environment that financial markets, policy frameworks, and corporate planning assumptions are not remotely prepared for.
GDP and GNP: A Growth Regime Shift
Scenario B implies U.S. real GDP sustaining at approximately 4.5% annually — double the prior decade's trend rate of roughly 2%. To calibrate that: if you told a strategist in 2019 that the U.S. would average 4.5% real GDP growth for seven consecutive years, they would have assumed a wartime mobilization or a demographic miracle. Agentic AI, applied to a $23.4 trillion services base, produces that outcome through pure productivity arithmetic.
Scenario C — 6% to 7% real GDP growth for five years — is a number the U.S. has not sustained since the immediate postwar period of 1946 to 1952. It would represent the largest peacetime growth surge in modern American economic history. And as noted above, GNP outperforms even these GDP figures as U.S. firms deploy agent infrastructure against foreign service markets, capturing offshore margin on top of domestic productivity gains.
Services-Price Deflation: The Fed's Problem Is Repriced
One of the least discussed implications of agentic AI is what it does to the price of services. Legal fees, consulting retainers, accounting bills, financial advisory costs — these are the categories that have driven services inflation for two decades, precisely because they are labor-intensive and the relevant labor is credentialed and scarce.
When agent workflows replace 40% of the labor input in these categories, delivered costs fall sharply. Under Scenario B, cumulative services-price deflation of 18% over seven years. Under Scenario C, 28% over five years. Kevin Warsh — widely considered the leading candidate for the next Fed chair — has publicly called AI a "significant disinflationary force" and argued explicitly for preemptive rate cuts on this basis. If services costs fall 20 to 30%, headline CPI goes negative in several categories, real rates tighten even as nominal rates fall, and the entire long-duration investment thesis reprices upward.
Labor Share Collapse: The Mirror Image of the 1920s
Labor's share of U.S. GDP is currently approximately 56% — already at multi-decade lows following decades of gradual erosion. Our scenario framework projects further deterioration: to 54% in Scenario A, 49% in Scenario B, 45% in Scenario C.
The significance of 45% labor share is difficult to overstate. It would represent the lowest share of national income going to workers in the recorded data history of the U.S. economy. And unlike the gradual erosion of the past forty years, this would be a compression event occurring over five to ten years — faster than any policy mechanism can respond.
This is the mirror image of what happened in the 1920s, when electrification augmented workers rather than replacing them. Manufacturing workers running electric equipment were more productive and were paid more for it — labor share rose during the electrification boom. Agentic AI substitutes for the worker entirely. The productivity gains do not flow to labor. They flow to capital. We will return to this in detail in Article 2.
The AI Productivity Gap: Bifurcation, Not a Rising Tide
The White House Council of Economic Advisers, in its January 2026 report, used a phrase that deserves to become the organizing concept for how investors and business leaders think about this transition: the "great divergence." Not a rising tide lifting all boats — a fissure running through the economy between firms and individuals that adopt early and those that do not.
At the firm level, early adopters in AI-leveraged services see operating margins expand faster than revenue grows. A law firm, accounting practice, or research shop delivering the same revenue with half the credentialed headcount produces three to four times the operating income. Equity multiples re-rate upward accordingly.
At the individual level, the split is harder. The top quintile of credentialed professionals — those who successfully integrate agent workflows into their practice — sees real wage growth accelerating. The middle two quintiles, those who are neither early adopters nor sufficiently senior to be insulated by client relationships, face stagnation or displacement without a clear path to equivalent income. This is not a prediction. The Conference Board data and the enterprise deployment evidence already show it beginning.
VII. The Distributional Catch — And Why It Matters for Markets
The macro case for agentic AI as a productivity miracle is, in our assessment, correct. The numbers work. The mechanism is sound. The enterprise evidence supports the thesis case rather than the mainstream case. Investors who position for a structural GDP growth upgrade, services-margin expansion, and rate-sensitive duration trades are, we believe, positioned correctly for the primary wave.
But the macro upside is bundled with something that pure productivity models do not capture and that markets are materially underpricing: the most significant redistribution of income from labor to capital since the Industrial Revolution, occurring at a speed that no prior technology transition has approached.
Capital captures the gains. When an AI-leveraged professional services firm replaces half its associate-level headcount with agent workflows, the margin expansion accrues entirely to equity. The productivity gain does not flow back to the remaining workers in the form of higher wages. It flows to ownership. The Buffett, Bezos, and Musk wealth-concentration story of 2010 to 2024 — which drove the political currents that produced both the Sanders movement and the MAGA movement — looks modest compared to what the capital concentration math of 2026 to 2032 implies.
Real wages bifurcate violently. The top quintile of credentialed professionals who successfully navigate the transition — who build the agent leverage into their practice before the market revalues their labor downward — sees real wage growth of 5% to 10% per year. The middle two quintiles, absent a structural reskilling mechanism, see stagnation or decline. This is not a gradual adjustment that labor markets can absorb through normal mechanisms of wage negotiation and skill upgrading. The compression timeline is too short.
The political risk is the most underpriced variable. A productivity shock of this magnitude, concentrated on capital, with a 5 to 7 year compression window, generates political pressure that equity markets are not pricing. The White House is already using the language of "great divergence." The policy response — redistributive taxation on AI-driven profits, mandatory-human requirements in regulated professions, credentialing tightening by professional licensing boards, potential payroll tax restructuring — is not a tail risk. It is the base case second-order effect of a scenario where Scenario B or C plays out as modeled.
Investors who own the productivity upside without hedging the distributional and political second-order risk are owning half the trade. The full position requires thinking about both the winners of the primary productivity wave and the instruments that benefit from the policy and fiscal response that follows.
We will quantify that full position in Article 3.
First, though, the historical analog that makes this thesis legible — not as a speculative forecast about an untested technology, but as a recognizable pattern from the most consequential decade in American economic history.
The last time the United States absorbed a general-purpose technology shock of this magnitude, it produced seven years of extraordinary growth, the greatest bull market the country had ever seen — and then 1929. That history is more instructive than any current forecast model. It is where we go next.
The author holds positions in securities discussed and reserves the right to buy or sell shares at any time without notice. This article is for informational and educational purposes only and does not constitute investment advice. Past performance is not indicative of future results.