The Scissors: Why Plumbers Are Winning and College Grads Are Losing


A plain-English guide to America's split job market, and why it points to a productivity boom.
The short version
For twenty years, if you were young and looking for work, having a college degree meant an easier time than not having one. Both groups had good years and bad years, but they had them together.
In 2024, that stopped. Young Americans without a degree started having one of their best job markets in twenty years. Young Americans with a degree started having one of their worst.
This report explains why. The one-word answer is scissors. Two blades are closing on the job market from opposite directions at the same time. One blade is cutting the supply of people who work with their hands. The other is cutting the demand for people who work at a desk.
The same forces that are hurting new graduates are about to make the whole economy far more productive. That is not a contradiction. It is the same event seen from two sides.
What the numbers say
Economist Gad Levanon of the Burning Glass Institute did something simple. For each group of workers, he asked: compared with your own history since 2003, how good is your job market right now? A score of 50 means an average year. A low score means one of your best years. A high score means one of your worst.
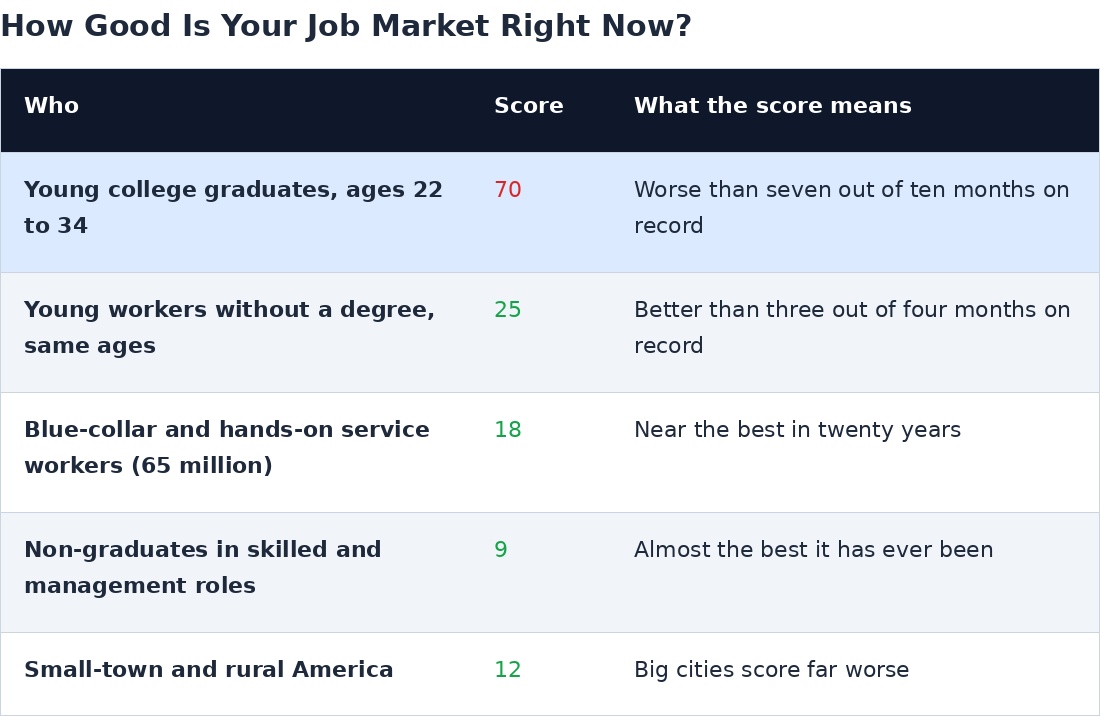
To be clear: graduates still have lower unemployment overall. Prime-age workers with a degree are at 2.7% unemployment, against 4.7% for workers with only a high-school education. Nobody has traded places. But the direction has flipped, and the people at the bottom of the ladder feel direction more than levels.
How we got here: three slow changes
None of this happened overnight. Three things shifted over 25 years and built the structure.
One. The factories left. Competition from China wiped out roughly a million manufacturing jobs and about two million jobs in total between 1999 and 2011, on the CSIS estimate. Factories had been the front door to skilled hands-on work for young people without degrees. When they closed, the apprenticeships and trade pipelines that fed from them closed too. The message to every high-school senior became: go to college or wait tables.
Two. Immigrants filled the hands-on jobs that were left. Unauthorized immigrants came to make up about 23% of construction laborers and 19% of carpenters, per the Center for American Progress, and 26% of farm workers on Pew's count. Census Bureau figures put net immigration at an all-time high of 2.7 million in 2024. Plenty of hands kept wages in those trades low, which told native-born kids, again, that manual work does not pay.
Three. Everyone went to college. The number of bachelor's degrees awarded each year rose from 1.24 million in 2001 to about 2.06 million in 2024, a 66% jump, according to federal education statistics. The share of jobs that actually require a degree barely moved, from about 21% to 25% on Bureau of Labor Statistics figures. We nearly doubled the graduates and added a handful of graduate jobs.
Why did it not hurt sooner? Because the extra graduates took jobs that did not need a degree. Half of new graduates were working in non-degree jobs a year after finishing, and 45% still were ten years later, on the Burning Glass and Strada research. That was the cushion. It hid the oversupply for two decades. In 2024 the cushion ran out.
What set it off: two fast shocks
Shock one: white-collar hiring froze, and AI locked the freeze in. Starting in late 2022, the industries that hire new graduates, meaning tech, consulting and finance, stopped hiring. Levanon's figures show entry-level job postings down 15% and applications per posting up more than a quarter. Then AI arrived and turned out to be very good at exactly the tasks a first-year employee does: drafting, research, basic coding, basic analysis. A Stanford study of payroll records found employment of 22 to 25 year olds in AI-exposed jobs is now 19% below where it should be. Not because they were fired, but because they were never hired.
Shock two: immigration reversed just as AI started a construction boom. Census Bureau data show net immigration falling from 2.7 million in 2024 to 1.3 million in 2025, heading toward roughly zero in 2026. The unauthorized population is estimated to have fallen by 2.3 million. At the same moment, AI companies began building data centers at a record pace of about $50 billion a year, and roughly half the labor cost of a data center is electrical work. As Levanon puts it: "Data centers are built by electricians." The same technology cooling desk jobs is hiring hard hats.
One honest note: this is not a boom in all construction. Home building is down. The trades are tight mainly because the supply of workers collapsed, not because everyone is building.
The billable hour is dying
Here is the part that turns a bad year for graduates into a permanent change.
More than 20 million Americans, including lawyers, accountants, consultants, engineers, and many doctors and financial advisers, are paid directly or indirectly by the hour. About 10.8 million work in professional and technical services alone.
Now think about what AI does to that model. If a task that took five hours now takes one, a firm billing by the hour just lost 80% of its revenue on that task. A firm that charges for the result instead of the time just gained 80% margin. Firms have no choice. About a quarter of McKinsey's fees are now based on results delivered rather than hours. Seventy-two percent of law firms now offer flat or alternative fees. PwC cut 5,600 jobs, its first shrink since 2010, and dropped a pledge to hire 100,000 people.
Why does this hit graduates hardest? Because the hourly model needed a pyramid: lots of junior people billing lots of hours that the partners marked up. That pyramid was the hiring machine for a huge share of every graduating class. Pay-for-results needs the opposite shape, a few experts who own the outcome, backed by AI agents instead of associates. The senior expert is worth more than ever. The junior rung is gone. That is exactly what the data show. Graduates over 35 are having a normal year. Graduates aged 22 to 26 are having one of their worst.
We have seen this before: the 1920s
JD Unfiltered has long argued that the 2020s are replaying the 1920s on a 99-year delay: 1921 was 2020, and 1927 is 2026. The job market of the 1920s tells the same story.
Immigration was cut off. The 1921 and 1924 quota laws cut immigration by 80%. Wages for low-skilled laborers rose sharply and stayed up for decades.
Factories electrified and stopped hiring. Manufacturing output rose 50% over the decade with no growth in factory jobs. The new jobs went to finance, services and utilities.
One big group was left out. Farmers, a fifth of the country, spent the Roaring Twenties in a depression while everyone else prospered. Today's young graduates are this cycle's farmers.
Education flooded the white-collar market. The high-school movement produced so many clerks that the pay premium for office work collapsed, as Goldin and Katz documented. The bachelor's degree is today's high-school diploma.
Four for four. The analog is holding.
Why this points to a productivity boom of 5 to 6% a year
Productivity means how much the economy produces for each hour worked. It is the single number that decides whether living standards rise. Since 2019 it has grown about 2% a year on Bureau of Labor Statistics figures. JD Unfiltered expects 5 to 6% a year starting in 2026 and lasting at least five years. Here is why in plain terms.
The 1920s already did it. Factory output per hour rose 72% between 1919 and 1929, about 5.6% a year. But factories were only a quarter of the economy, so the national number came in around 2 to 4%.
This time the sector being transformed is three times bigger. Services employ 72% of Americans. For seventy years, services never got cheaper the way goods did. A haircut, an audit or a legal brief took the same human hours in 2020 as in 1950. AI is the first tool that brings factory-style cost cutting to desk work. Apply a 1920s-factory-sized gain to a sector three times the size and the national number heads toward 5 to 6%, not 2.
The key input is getting cheaper faster than electricity ever did. The cost of running top-tier AI has fallen roughly 95% in two years and about 1,000-fold in three. Prices fell another 43% in just ten weeks this summer. Electrifying a factory took years. An AI seat costs a few hundred dollars a month and deploys in an afternoon.
Scarce workers force the change. When you cannot hire people, you buy tools. Immigration is near zero, tradesmen are retiring, and the non-degree workforce is shrinking. On the desk side, firms are replacing junior hires with AI agents. Both blades of the scissors push output per worker up.
Pay-for-results makes it show up in the statistics. When professionals charged by the hour, doing something faster counted as producing less. When they charge for the result, the same work counts at full value against a fifth of the hours. The billing shift is the accounting that lets the boom register.
Why at least five years: the 1920s burst lasted a full decade and was still going when the credit system broke in 1929. AI data-center spending is committed through 2030. AI costs are forecast to fall another threefold by 2030. And spreading a new tool through three-quarters of the economy takes five to seven years by any historical standard. We are at the front edge, not the middle.
The catch: government statistics are bad at measuring services, so the official number may lag reality by years and catch up through revisions, as happened in the late 1990s.
What this means for you
If you are a high-school senior, or a parent of one: the math has changed sign. An electrician's apprenticeship now carries less risk and no debt compared with a general business or humanities degree. Trade-school enrollment covers only 55 to 60% of the electricians the country will need.
If you are in college or just out: major and internships matter more than the school's name. Health professions, engineering, accounting and computer science hold up. General business and the humanities do not. An internship roughly halves your odds of ending up underemployed.
If you are a mid-career professional paid by the hour: the move to being paid for results is coming whether you like it or not. Owning an outcome, and the tools and data to deliver it, is the only durable position. Twenty million people who sold time are being asked to become something closer to business owners.
If you invest: electricians, power infrastructure and the schools that train trades face a decade of shortage. Professional firms stuck on hourly billing with big junior staffs face shrinking margins. Those switching to results-based pricing with their own AI face expanding ones.
Could this be wrong?
Yes, in a few ways.
The measuring stick flatters the trades. It goes back to 2003, which includes two recessions that hit blue-collar work hardest. That makes today's blue-collar numbers look a little better than they are.
Young non-graduates still have higher unemployment in absolute terms. It is 8.0% for high-school-only 22 to 26 year olds against 6.1% for graduates. This is about direction, not levels.
Blaming AI is still partly a guess. The same industries also over-hired in 2021 and then got hit by higher interest rates.
The tight trades market comes from fewer workers, not more work. If immigration policy reverses, that blade loosens.
Robots may eventually do to the trades what AI is doing to desks.
The productivity forecast could miss. Companies may adopt slowly, total AI bills may rise even as unit prices fall, or a financial shock may halt data-center spending. Or it could be right and still not appear in the official numbers for years.
The one thing to remember
The graduate slump and the coming productivity boom are the same thing. In the 1920s, farm misery and the factory miracle were the same decade. Today, the worst job market for young graduates in twenty years and a 5 to 6% productivity surge are the same event. The productivity gain is, quite literally, the hiring that did not happen.
This report is a plain-English summary of a JD Unfiltered framework, written for research and discussion. Figures are drawn from published research and government data as cited in the text. Forward projections are outputs of the JD Unfiltered framework, not predictions of certainty, and nothing here is investment, career or education advice.
The authors hold positions in securities mentioned and reserve the right to buy or sell shares at any time without notice.