The Post-War American Supercycle: How Eight Converging Forces Are About to Reshape the Global Economy

The Iranian strikes on Qatar's Ras Laffan complex have removed ~17% of global LNG capacity for 3–5 years, and the broader Middle East conflict has temporarily spiked oil to $100+/bbl — but the structural aftermath overwhelmingly favors the United States across every major economic vector: energy, petrochemicals, AI, defense, digital finance, and capital flows.
Qatar's Multi-Year Outage
QatarEnergy CEO Saad al-Kaabi confirmed that two of Qatar's 14 LNG trains and one gas-to-liquids facility were destroyed, wiping out approximately 12.8 million tons per year of LNG capacity. Replacement gas turbines face 2–4 year global delivery lead times. QatarEnergy has declared force majeure on contracts supplying Italy, Belgium, South Korea, and China. Beyond LNG, Qatar's condensate exports drop ~24%, LPG by 13%, and helium by 14%.
The US Feedstock Advantage at $2.89
At today's Henry Hub price of $2.89/MMBtu, the US cost spread is roughly 6x versus European TTF at €55/MWh (~$16–17/MMBtu equivalent). The EIA projects US production hitting record highs in both 2026 and 2027, with the full-year Henry Hub average recently revised down 13% despite surging LNG export demand. This translates directly into petrochemical dominance:
- Ethylene: US ethane-cracking cost ~$250–300/ton vs. $800–1,000+/ton for European/Asian naphtha crackers — a $500–700/ton margin advantage
- Ammonia/Fertilizer: Natural gas is 70–80% of ammonia cost; at $2.89, US urea is the cheapest globally
- Methanol → Plastics & Synthetics: Polyethylene, PVC, packaging, synthetic fibers, housing materials
- Propylene/Butadiene: Synthetic rubber, automotive, clothing
Over $50 billion in Gulf Coast ethane cracker and polyethylene capacity has been built since 2014, and the Qatar disruption ensures this investment cycle accelerates.
US LNG Fills the Gap
US LNG exports rose 17% year-over-year in February 2026 as new facilities ramped. US developers now have 117.9 million tons/year of additional capacity under construction through 2030, on top of 139 million tons already operating. The Qatar outage has widened the US-European LNG spread through at least 2029.
Oil: The Post-War Collapse to $50–55
WTI settled at $102.88 on March 30, with Brent at $110.69, driven by Strait of Hormuz disruptions. But multiple forces are converging to create a massive oversupply once the conflict resolves:
- US producers scrambled to hedge at $90–100+ after the Iran strikes, locking in 12–24 months of windfall prices via unprecedented options and futures volume on ICE and NYMEX. Producers had budgeted 2026 at just $55–60 WTI, so they are locked into capacity increases regardless of where spot goes.
- EIA projects US output growing +580K bpd by exit-2027 to 13.83 Mbpd — these drilling commitments are made and won't be reversed.
- OPEC+ has capacity to unwind cuts, and Middle East producers will pump aggressively to fund reconstruction. A "rebuilding tax" for the new peaceful Iran means every barrel is needed for revenue.
- Pre-war consensus from the EIA, J.P. Morgan, and Goldman Sachs all had Brent at $54–67/bbl for late 2026–2027, reflecting structural oversupply absent the war premium.
When the Strait reopens and OPEC+ ramps, the world faces a 2–3 million bpd oversupply with US production at record highs, locking WTI into the $50–55 range for an extended period. US producers hedged at $100 earn a $35–50/bbl windfall above spot for 12–18 months, generating enormous free cash flow even as prices normalize.
The Strait of Hormuz: A Structural Pricing Reset
Any resolution to the conflict is unlikely to simply reopen the Strait of Hormuz under prior conditions. A more durable outcome is a negotiated framework that embeds a reconstruction-linked transit cost into global oil flows.
A ~$10/bbl fee on oil moving through the Strait, directed toward rebuilding Iran, would function as a structural tax on globally traded energy. This disproportionately impacts import-dependent regions like China, Europe, and much of Asia, while leaving US production largely unaffected.
The result is a clear cost advantage for US producers and consumers, reinforcing the broader feedstock edge already in place. In effect, the global energy market becomes partially segmented, one system anchored by low-cost US supply, and another burdened by transit costs and geopolitical friction.
US AI Dominance: The Compute Advantage
Morgan Stanley estimates nearly $3 trillion in global AI-related infrastructure investment flowing through the economy by 2028. Four of the Magnificent 7 alone committed $650 billion in 2026 capex, a 71% year-over-year increase. AI-related investment contributes approximately 25% of US GDP growth this year. Critically, data centers need cheap, reliable power, and US natural gas at $2.89 provides exactly that.
The GENIUS Act, CLARITY Act, and Dollar-Led Tokenization
The GENIUS Act (enacted July 2025) requires all stablecoin issuers to maintain 100% reserve backing with US Treasuries and liquid assets, with monthly public disclosure. The OCC and FDIC are finalizing implementing regulations for Q3 2026. Every USDC or regulated stablecoin in circulation creates a corresponding pile of Treasury demand — the stablecoin market already exceeds $180 billion and is growing rapidly.
The CLARITY Act (passed the House July 2025 with a 294–134 bipartisan vote) establishes clear CFTC jurisdiction over digital commodity spot markets while maintaining SEC authority over investment contract assets. It creates registration regimes for digital commodity exchanges, brokers, and dealers, plus safe harbors for DeFi developers. The Senate is working toward passage in 2026.
Together, these laws make the US dollar the native currency of programmable finance. Real-world asset tokenization is moving from experimentation to institutional infrastructure, the NYSE has unveiled 24/7 blockchain-based trading of tokenized stocks, and Nasdaq has proposed SEC integration of tokenized assets. All overwhelmingly USD-denominated.
Capital Flight and the Dollar Vortex
The roughly $45 trillion in deposits held in authoritarian and semi-authoritarian jurisdictions faces a structural incentive to migrate. US-domiciled funds attracted nearly $400 billion in Q1 2026 alone, with foreign private investors purchasing over $650 billion in US equities and $440 billion in Treasuries in 2025.
Iran faces dollarization or collapse, the Atlantic Council warns of "a continued slide toward monetary irrelevance" as the rial collapses under maximum pressure sanctions. Even 1% migration of the $45T in authoritarian deposits = $450 billion of incremental US inflow.
The euro faces a painful squeeze. The ECB held at 2.15%, but market-implied rate hike probability has surged to 65% to combat energy-driven inflation. Hiking into a weak Eurozone risks recession; not hiking invites capital exodus to higher-yielding US assets. Citi projects EUR/USD falling to 1.10 by Q3 2026, and if the full US advantage plays out, near-parity (~1.02–1.05) is plausible by mid-2027.
Defense: US Equipment Surge
- NATO European spending hit $574 billion in 2025, up 20% in real terms, with a new 5% GDP target by 2035
- Lockheed Martin hit 52-week highs on 191 F-35 deliveries and a $25.36B microelectronics contract; THAAD production set to quadruple
- RTX posted $88.6 billion in 2025 sales; Patriot demand surging
- US defense budget exceeds $901 billion, with $1.5 trillion advocacy for 2027
Combined Impact Estimate
The post-war normalization scenario produces eight mutually reinforcing GDP channels:
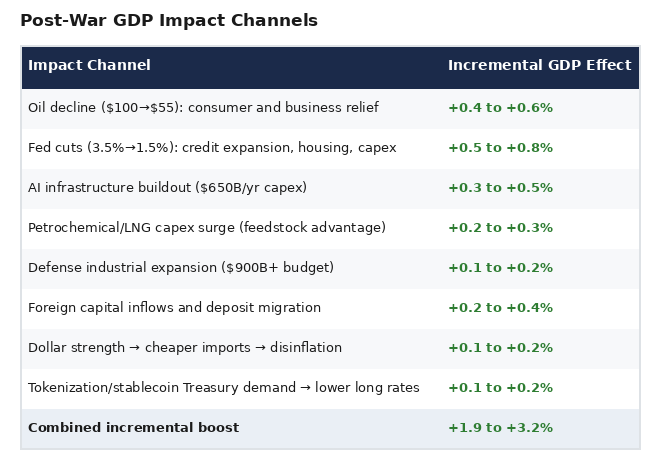
The Fed currently projects just 1.4% GDP growth for 2027. If even half of these channels activate as described, actual 2027 growth could reach 3.5–4.5% — a massive beat versus consensus.
The Inflation-to-Rate-Cut Cascade
The path to 1.5% Fed funds in 15 months requires oil falling to $50–55/bbl, which:
- Pulls headline PCE from 2.7% toward 1.5–1.8% as gasoline drops from ~$3.34/gal back to ~$2.20
- Core PCE follows with a lag, dropping below 2.0% as transportation and input costs normalize
- The Fed, seeing inflation below target with growth accelerating from supply-side investment, has room for 200+ basis points of cuts over 12–15 months
- A stronger dollar and cheap imports reinforce disinflation, giving the Fed cover to cut aggressively
At 1.5% Fed funds with $310–330 S&P 500 EPS (boosted by oil relief + AI + defense + rate cuts), the equity market re-rates from ~21x forward P/E to 24–26x on lower discount rates. That implies an S&P 500 range of 7,750–8,580, a 38–53% move from current levels.
The Self-Reinforcing Loop
Every pillar feeds the others:
- $2.89 gas powers AI data centers, petrochemical plants, and LNG terminals
- Oil at $50–55 crushes inflation, enabling rate cuts that boost housing, credit, and capex
- Fed at 1.5% drives equity re-rating and foreign capital inflows
- GENIUS + CLARITY Acts channel global savings into Treasury-backed stablecoins and tokenized USD assets — creating structural demand for US debt at exactly the moment supply increases
- Defense supremacy validates the US as the global security guarantor, attracting allied capital
- Deposit migration from authoritarian regimes accelerates as stablecoin rails offer 24/7 USD access without banking relationships
- Euro weakens toward parity as ECB faces the impossible choice of hiking into recession or watching capital flee
- Iran dollarizes or collapses, eliminating a major source of geopolitical risk premium
The US emerges as the swing supplier of energy, compute, financial infrastructure, and security — a combination that should sustain elevated productivity growth, capital inflows, and equity market appreciation through the end of this decade.