The Great Japanese Deposit Migration and the Bank of Japan’s Impossible Trilemma


How Deposit Flight into USDC and Gold Tokens Forces Yen Decline, Traps the Government in a Refinancing Spiral and Ends the Nikkei Bull Market

Executive Summary
Japan has crossed a historic financial inflection point. For the first time since the Bank of Japan began compiling comparable data in 2001, bank loans are growing roughly three times faster than deposits — not because lending is hot, but because the ¥903 trillion deposit base is structurally leaking. Japanese households, holding a record ¥2,351 trillion (~$14 trillion) in financial assets, are abandoning decades of cash hoarding.
Two regulatory catalysts converged: the U.S. GENIUS Act legitimizing dollar stablecoins as regulated money, and Japan’s June 1, 2026 law legalizing USDC for shopping of all types. With USDC paying 5–10% daily-compounding yield versus 0.33% on yen deposits, the migration is self-reinforcing.
Central thesis: deposit flight forces the yen lower, which deepens purchasing-power fear and accelerates further flight — trapping the BOJ in a trilemma where it cannot simultaneously defend the yen, protect the budget, and preserve the banks. The eventual resolution — higher bond yields — ends the Nikkei bull market and triggers a combined yen crisis and equity crash.
The Dramatic Shift in Consumer Asset Holdings
For 25 years, deflation made cash a winning real asset; as recently as early 2024, Japanese households held 51% of assets in cash versus 12% for Americans. The combined share of stocks and investment trusts surged from a 2012 trough near 8% to roughly 20% by end-2025, approaching the 1989 bubble peak of ~29% — driven this time by inflation defense, not speculation.
The catalysts were the return of inflation (CPI ~4%) and the new NISA (Jan 2024), which drove a 27.4% single-year surge in investment-trust holdings. The money went abroad: foreign-stock funds were the largest purchase category at 33.3%, Japan’s U.S. equity holdings doubled from 8% to 16%, and total foreign assets hit a near-record $4.95 trillion.
Deposits Are Leaving the Banks
Loans rose +5.4% YoY in April 2026 (+5.7% in May) while deposits grew only +1.9% — excluding the 2020 pandemic, the biggest loan-growth gain since data began in 2001. Total deposits stood at ¥903.76 trillion in March 2026.
The loan-to-deposit ratio climbed to 65.7% by September 2025, the highest since March 2020, and the household cash-and-deposit balance declined YoY in mid-2025 for the first time since December 2006. This is the only episode in history where loans outgrew deposits due to active deposit flight rather than policy support or lending excess.
The Twin Catalysts and the Yield Arbitrage
The GENIUS Act drove the global stablecoin market past $300 billion. Japan’s June 1, 2026 law reclassified USDC as a legal electronic payment instrument usable for shopping of all types — with USDC the first and only approved global dollar stablecoin and in-store payments live in Tokyo
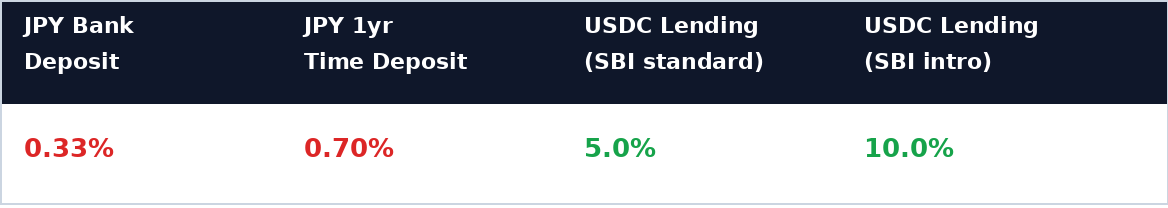
SBI VC Trade launched Japan’s first licensed USDC lending at 10% introductory / ~5% standard APR versus 0.33% yen deposits. Japanese crypto allocation is just 0.56% versus 3.95% in the U.S. — convergence alone implies trillions of yen in flows.
The Feedback Loop and the BOJ Trilemma
Zero-yield deposits plus new legal pathways drive savers into USDC, gold tokens, and U.S. equities; this requires selling yen; the yen falls; falling yen erodes purchasing power; fear accelerates the next wave of flight.
The BOJ cannot simultaneously defend the yen (requires hard hikes leading to fiscal crisis), protect the budget (requires staying low leading to yen collapse), and preserve bank stability. Every door leads to one of the others breaking.
USDC and Gold Token Demand Surge in Every Crisis Path
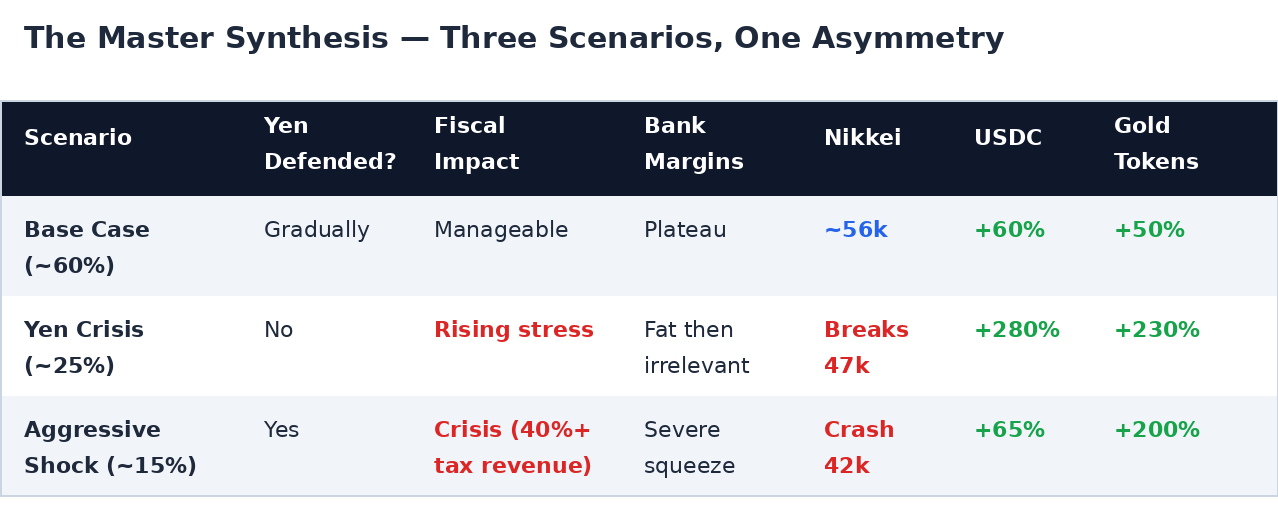
USDC demand from Japan quadruples (+280%) in the yen-crisis path versus +60% in the base case. Gold tokens peak in both crisis scenarios and uniquely are strongest in the equity-crash path (index ~200), hedging yen depreciation and systemic equity risk simultaneously.
The Yen Must Decline and the Government Is Trapped
With USD/JPY at ~161 and the 10Y JGB at ~2.65%, the yen is already pressured. Japan carries ¥1,185 trillion in JGB outstanding and must refinance ~¥120–150 trillion annually. The FY2026 budget assumes a 3.0% debt-servicing rate (highest since 1997), pushing debt service to a record ¥31.3 trillion, projected at 30% of budget by FY2029.
At a steady-state 4% JGB yield, debt service consumes over 40% of all tax revenue — the level where the debt spiral becomes self-reinforcing, since higher yields force more issuance, which pushes yields higher still.
The Endgame — Higher Rates Kill the Nikkei
The Nikkei reached a record ~73,000 this week, up more than 80% over the last 12 months. But the bull market’s fate hinges on the yen and JGB yields, not bank margins. In the yen-crisis path the index melts up then breaks toward 47,000; in the aggressive-defense path the discount-rate shock crashes it toward 42,000. Trigger thresholds: USD/JPY breaking 170 and the 10Y JGB breaking 3.5%.
The Master Synthesis
Conclusion
Japanese households are abandoning ¥1,000+ trillion in zero-yield deposits. The infrastructure for the alternative — USDC at 5–10%, gold tokens, and U.S. equities — went fully live in June 2026. Deposit flight forces the yen lower, deepening the fear that drives more flight, while the government remains trapped by ¥1,185 trillion of debt it must refinance into rising rates.
The investment conclusion is an asymmetry: USDC and gold tokens are the only assets that win across every scenario — modestly in the base case, explosively in a yen crisis, and as safe havens in a rate shock. Gold tokens uniquely pay off even in the equity-crash endgame. The eventual rise in bond rates that ends Japan’s bull market is not a tail risk — it is the structural destination this deposit-migration dynamic is driving toward.
Sources: Bank of Japan, FSA, MOF, JSDA, SBI VC Trade, Circle, Reuters, Bloomberg, Goldman Sachs, Bank of America, SBI Research Institute. Scenario probabilities and demand-index projections are illustrative analytical constructs, not market forecasts.
Disclosure: The author holds positions in securities and instruments mentioned and reserves the right to buy or sell at any time without notice. This analysis is for informational purposes only and does not constitute investment advice.