
The Clock, the Roll-Off, and the Productivity Test


A JD Unfiltered financial and economic briefing. Series: The Real Rate on the 99-Year Clock.
We believe a major acceleration in productivity is coming. In plain English, businesses will produce more for each hour of work, helping profits grow while easing pressure on prices. Our reading of the evidence fits the 99-year clock: investment in a powerful new technology comes first, and the broader gains in efficiency follow.
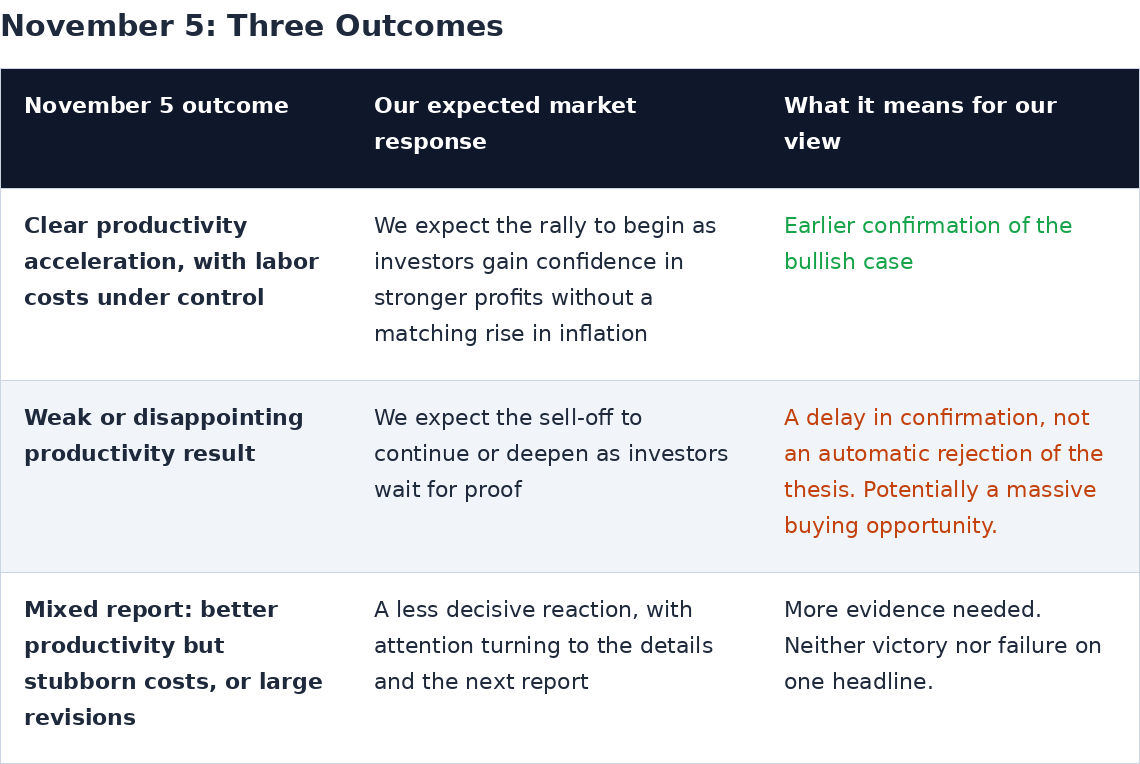
November 5 is our key short-term market event: the first estimate of third-quarter productivity is scheduled for 8:30 a.m. Eastern on the BLS calendar. Our call is straightforward: a convincing improvement should start the rally, and a disappointing report could extend the sell-off and, in our view, create a massive buying opportunity. One weak report would change the timing of confirmation, not our belief that the productivity acceleration is coming.
November 5: the key short-term market event
The report to watch is the preliminary third-quarter Productivity and Costs release, not a fourth-quarter result. It asks the question at the center of our argument: are businesses getting more done for each hour worked, and is that helping control the labor cost of what they produce?
Our expectation is a significant improvement. We read stronger growth and investment as signs that the productivity gains anticipated by the 99-year clock are approaching. The latest BEA GDP report showed faster investment, with computers and related equipment leading the increase in equipment spending. That supports our forecast, but spending on better tools and proving that those tools are improving efficiency are two different steps.
A report can improve on the previous quarter and still disappoint investors if they had expected more. We are not presenting an unverified Wall Street consensus number as the hurdle.
What would count as real improvement?
The previous quarter's nonfarm business productivity increased 1.4 percent at an annualized rate, on BLS figures. Annualized means the pace implied if that quarter's growth continued for a full year. It is not the actual gain during the quarter.
More output per hour. We want a meaningful acceleration, not a trivial increase. A reading of 4 percent or more annualized would be strong support under our own framework, not a claim about market consensus.
Labor costs under control. The labor cost of producing each unit should grow slowly or fall. That would strengthen the case for better profits and less inflation.
An improvement that can last. We want stronger production and signs of better business performance, not just a short-lived improvement caused by cutting hours. Revisions also matter.
If November 5 disappoints, our view is not that the boom has been canceled. It is that the market may have to wait longer for proof, and we would treat a disappointment-driven sell-off as a major opportunity to buy strong businesses at better prices, provided the broader case remains intact.
The next scheduled checks are the revised third-quarter report on December 8 and the preliminary fourth-quarter report on February 4, 2027. Those dates give us a way to test delayed confirmation rather than simply moving the goalposts.
Executive judgment
The next stage depends on businesses becoming more productive and inflation easing, not simply on interest rates going higher. September's average ten-year Treasury yield was 4.99 percent. After subtracting the previous twelve months' consumer-price inflation, the result was 1.25 percent, on the Federal Reserve's yield series and BLS CPI data. The gap between those numbers explains why lower inflation matters so much.
The economy is growing with less price pressure. Inflation-adjusted GDP grew 3.4 percent annualized in the third quarter, while quarterly PCE inflation slowed to 2.1 percent annualized, in BEA's advance estimate. GDP measures the economy's output, and PCE measures prices paid for consumer spending. We see this combination as encouraging evidence for the productivity acceleration we expect, while recognizing that the November 5 report is the direct test.
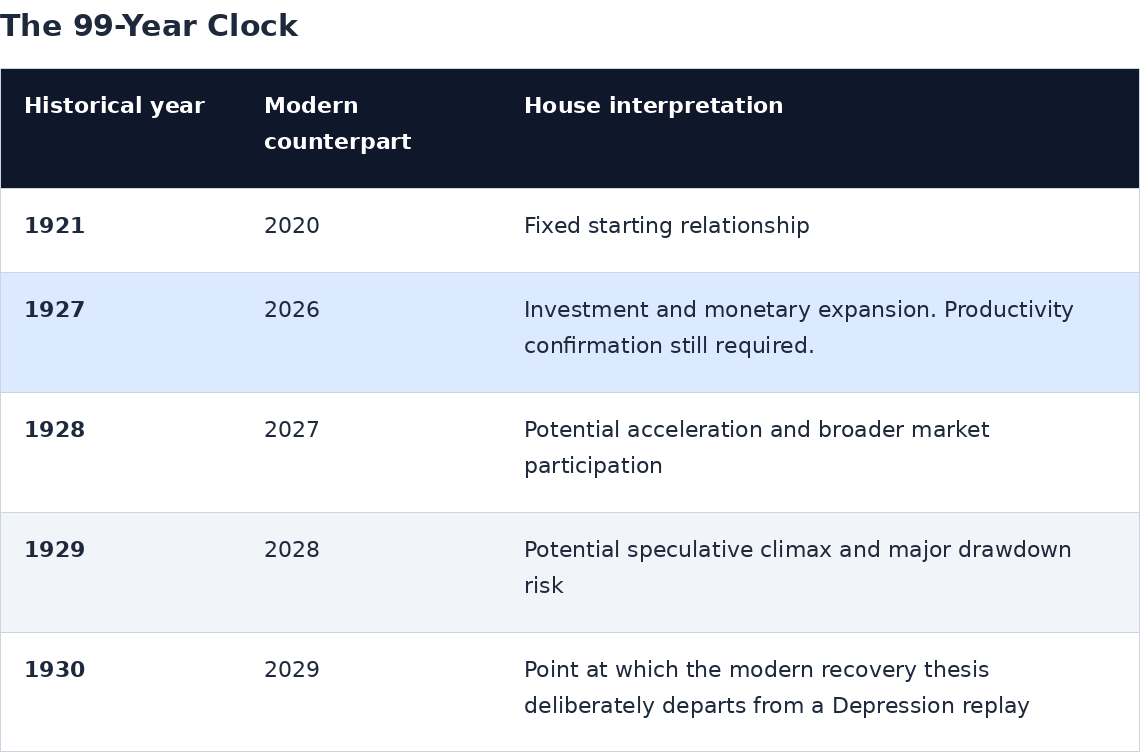
The clock remains fixed. 1927 corresponds to 2026, 1928 to 2027, and 1929 to 2028. A disappointing observation is not permission to slide the dates.
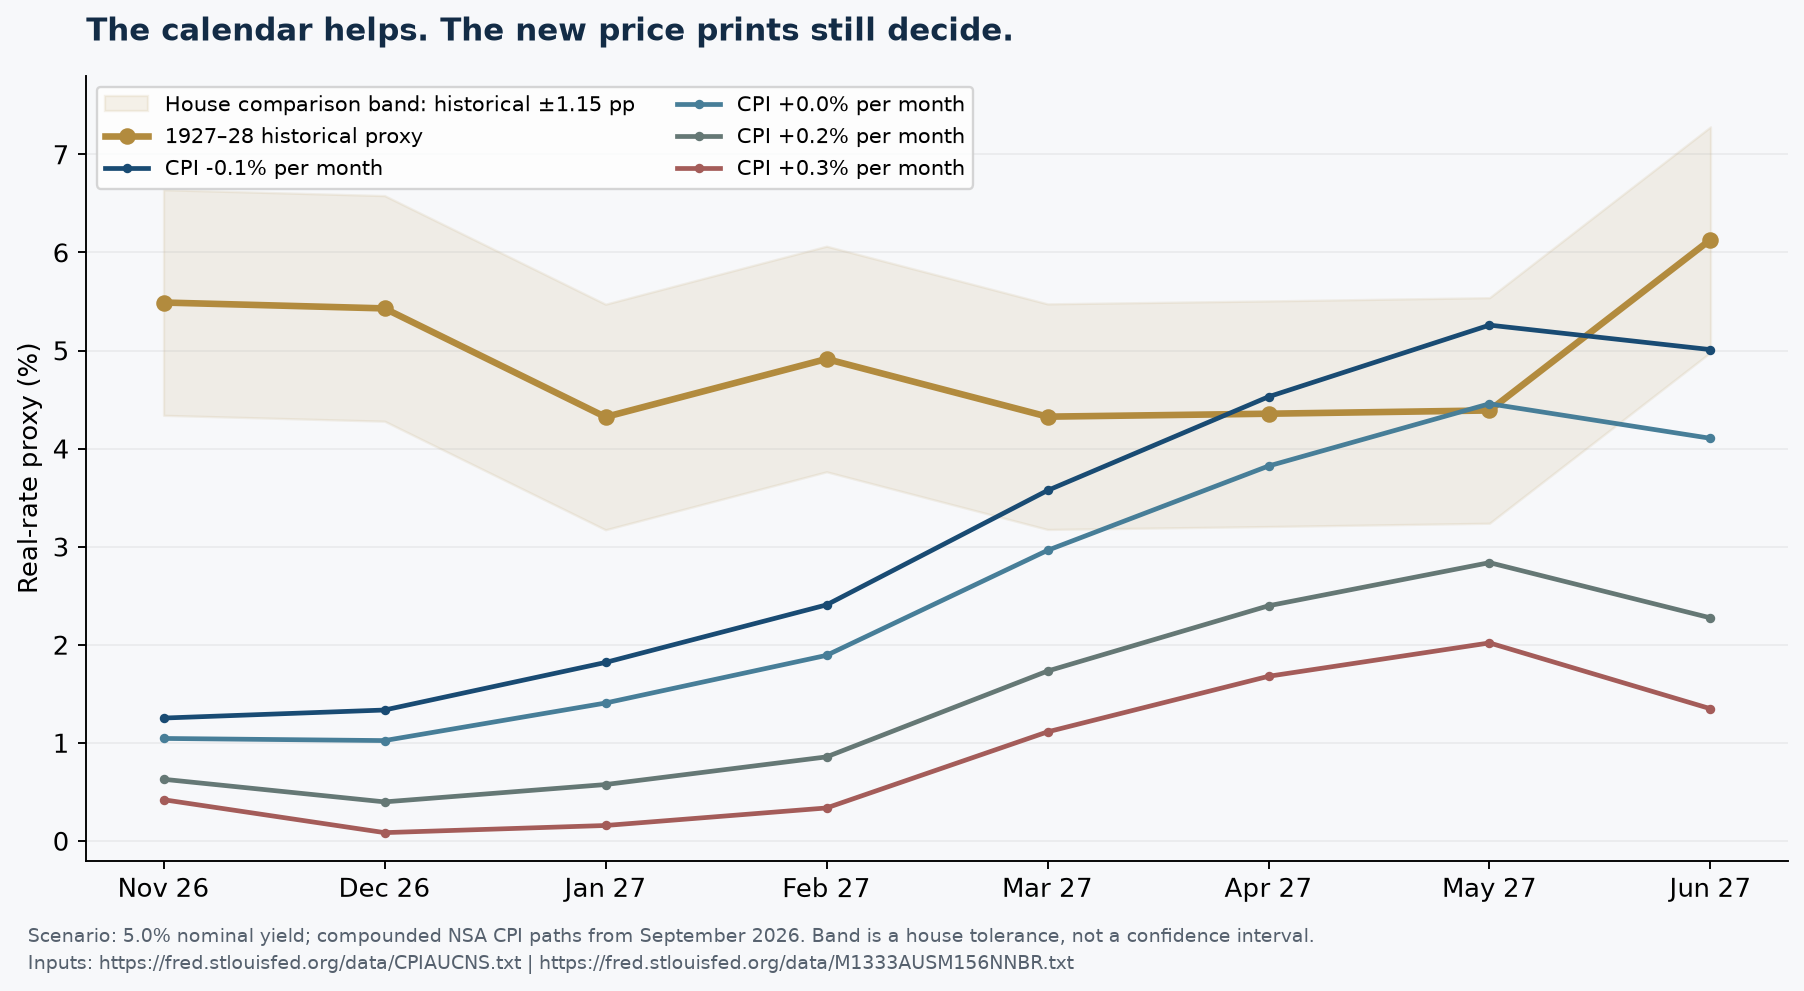
Q1 convergence is conditional. At an assumed 5.0 percent ten-year yield, the headline proxy reaches 3.57 percent in March 2027 if NSA CPI falls 0.1 percent monthly from September. Flat prices produce 2.96 percent, with entry into the house comparison band delayed until April.
Velocity has not confirmed the takeoff. Matched-quarter calculations imply Q3 M2 velocity declined 0.92 percent annualized and M1 velocity declined 1.03 percent, because money grew faster than nominal GDP.
November 5 comes first. We expect the third-quarter report to show meaningful improvement. Fourth-quarter results will test whether the acceleration continues or, if the first report disappoints, arrives later.
One miss is not the same as a broken thesis. A weak report would not by itself change our conviction. A repeated failure to improve, combined with worsening business conditions, would require a fresh look.
What the 99-year clock means
The clock compares today with the same point 99 years earlier. Our argument is that a powerful new technology encourages investment, businesses learn to use it, productivity improves, and investors eventually become too enthusiastic. We place AI adoption, energy investment and dollar financing within that sequence. We do not expect every monthly number to repeat history exactly.
The historical and modern bonds are not identical. The older series includes partially tax-exempt bonds that could be redeemed early, while the modern series tracks a standardized ten-year Treasury yield, on the NBER and Federal Reserve methodology notes. The comparison helps organize our thinking. It is not proof that markets must follow the same path.
The discipline is simple: keep the dates fixed and test whether the expected productivity gains arrive. A disappointing November report would not move the clock. It would mean the evidence is taking longer to catch up with our expectation.
Six real-rate measures, six different questions
The real interest rate is the interest rate after allowing for inflation. As a simple example, a 5 percent interest rate minus 2 percent inflation leaves about 3 percent, and that tells you more about purchasing power than the interest rate alone. Different inflation measures answer different questions, so the table keeps them separate.
CPI is the Consumer Price Index, and PCE is another measure of consumer prices. Headline includes all categories, while core leaves out food and energy. TIPS are Treasury bonds designed to adjust for inflation, and their market yield is different from simply subtracting last year's inflation from an ordinary bond yield.
The main anchor remains: real-rate proxy equals the long-bond yield minus twelve-month inflation.
September 1927's historical proxy is 4.44 percent, calculated from a 3.30 percent bond yield and CPI falling from 17.5 to 17.3 over the preceding year, on NBER yields and historical CPI. The table uses September 2026's 4.99 percent monthly-average nominal yield except for the separately dated TIPS observation.
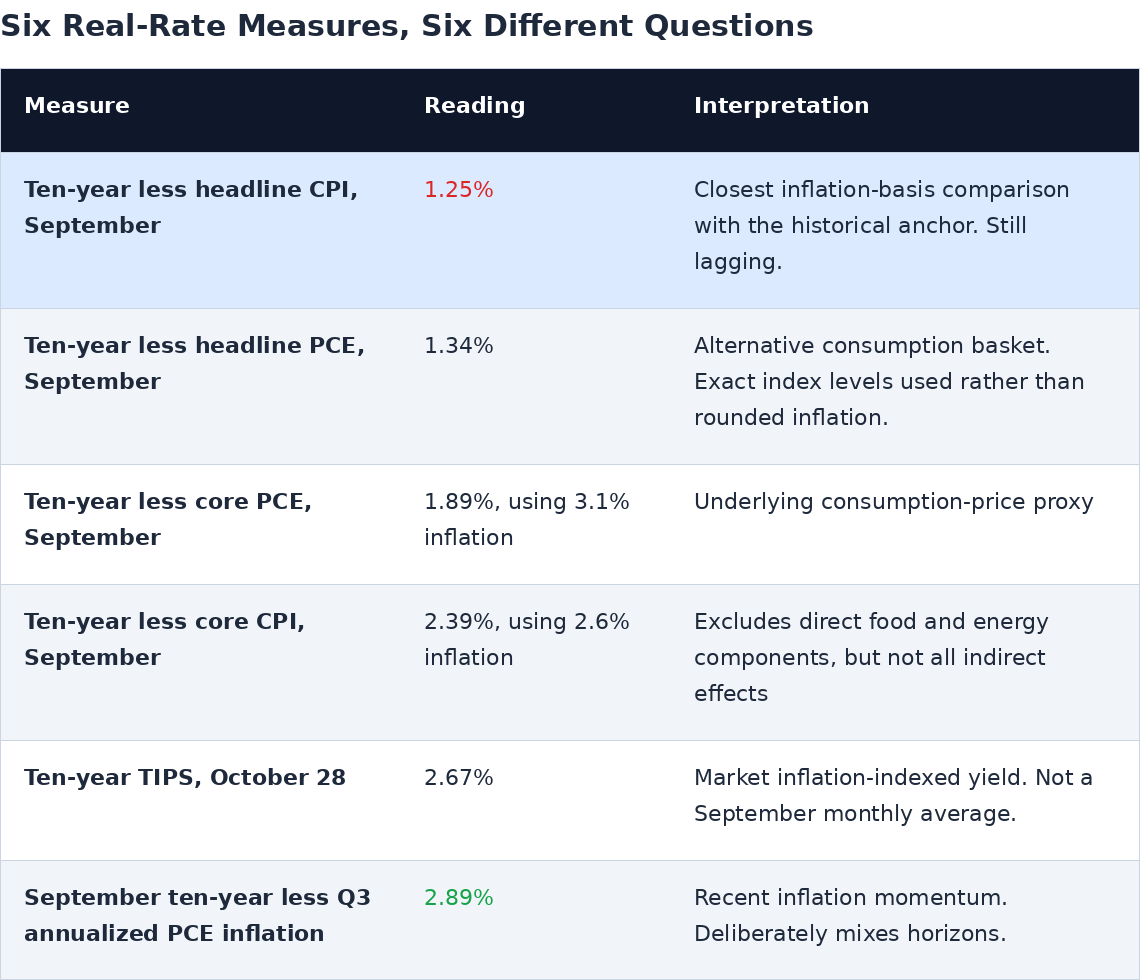
The message is straightforward: the measures that leave out direct food and energy changes, or focus on more recent inflation, look closer to the historical comparison. The full twelve-month inflation figure still lags. We should not confuse an encouraging early signal with a completed move.
The latest retrieved daily observation places the nominal ten-year at 5.05 percent and the ten-year TIPS yield at 2.67 percent on October 28, on the Federal Reserve's H.15 release. That sits within the house nominal-yield corridor, but a corridor is a forecast to test, not a policy guarantee.
Why inflation could fall as old price jumps drop out
Inflation compares today's prices with prices a year ago. When an unusually large price jump becomes more than a year old, it drops out of that comparison. The inflation rate can then fall even though grocery bills and other prices remain painfully high. This is what we mean by the roll-off.
Inflation at time t equals 100 times the ratio of the price at t to the price twelve months earlier, minus one.
The relevant CPI levels are 336.940 in September 2026, 324.054 in December 2025, 330.213 in March 2026, 333.020 in April and 335.123 in May. Holding the September price level unchanged would therefore leave December inflation at 3.98 percent, followed by 2.04 percent in March, 1.18 percent in April and 0.54 percent in May.
That gives us a reason to expect the inflation-adjusted interest-rate comparison to look better in the spring. But fresh price increases could cancel much of the benefit, which is why productivity matters: producing more efficiently can help control new cost increases.
What the different price paths would mean
The table assumes the ten-year yield stays at 5.0 percent and compares four paths for prices after September. It uses CPI before seasonal adjustments, labeled NSA, and shows the resulting inflation-adjusted interest rate rather than the inflation rate itself. The historical column uses the older bond and CPI series. These are illustrations of what different price paths would do, not official forecasts.
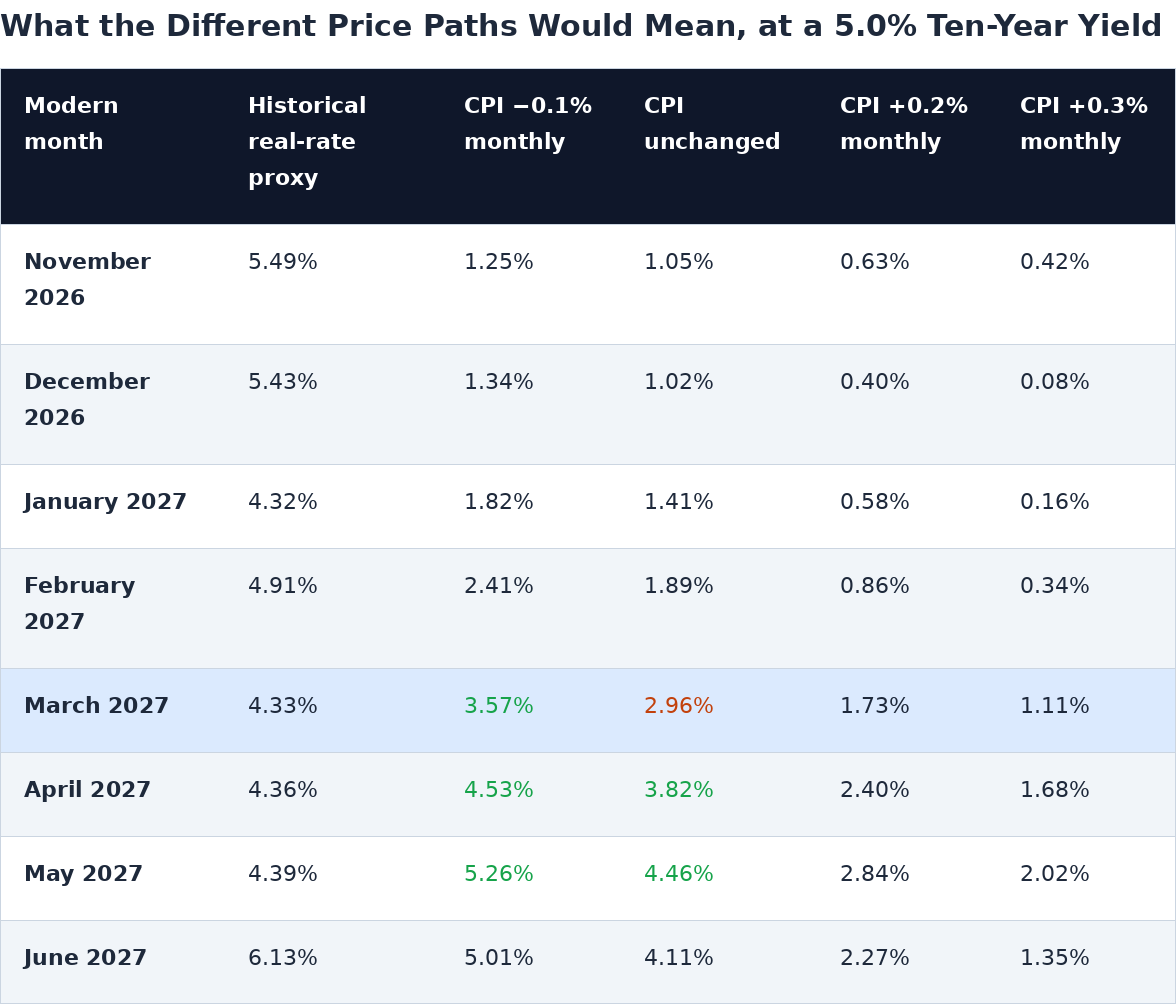
The shaded area in the opening chart marks what we call close enough to the historical comparison: within 1.15 percentage points. That is our chosen yardstick, not a statistical guarantee or a claim that the two periods are identical.
March entry. The declining-price path produces a 3.57 percent proxy against a historical 4.33 percent, inside that band. The flat-price path produces 2.96 percent, outside it.
Minimum price condition. At a 5.0 percent yield, average monthly NSA CPI would need to decline about 0.035 percent from September through March to reach the lower edge of the band.
April entry is not an unconditional backstop. Unchanged prices produce 3.82 percent, but persistent monthly inflation of 0.2 percent produces only 2.40 percent.
Convergence need not last. The historical June benchmark rises to 6.13 percent, and even the modern flat-price path falls outside the band again.
The distinction between the economic month and the release month matters. By the end of Q1 means a March observation, not necessarily proof available by March 31. March inflation is normally known only afterward.
October 2025 is missing in the retrieved CPI series, so a standard October 2026 year-over-year comparison cannot be constructed from those published observations without an explicitly labeled estimate. No interpolation is used here, and the flat-price scenarios refer to NSA index levels, not seasonally adjusted monthly inflation.
Productivity: getting more done for each hour of work
Our bullish case is about more than an inflation number improving as old months drop out. It is about businesses making more goods or delivering more services with each hour of work. That can support better pay and better profits without forcing prices higher at the same pace.
That distinction is visible in the latest GDP report: investment accelerated, computers and peripheral equipment led the equipment increase, and real final sales to private domestic purchasers rose 4.9 percent annualized, in BEA's technical notes. These are signs of investment and demand, not a direct measurement of the return on the installed technology.
What we expect November 5 and later reports to show
Output per hour. We expect a meaningful acceleration, with 4 percent or higher annualized growth offering strong near-term support. Sustained 5 to 6 percent growth remains our ambitious longer-term scenario, not a trend already established in the official numbers.
The cost of each unit produced. If workers produce more per hour, businesses can pay them more without raising prices as much. We want productivity gains to contain the labor cost of each unit, not simply fewer employees working longer hours.
Benefits across the economy. Gains should spread beyond AI developers and data centers into services, shipping, office work, factories and customer operations. Buying the equipment is only the first step.
Business results. Better profit margins and cash generation should show that the investment is paying off. Higher inflation-adjusted bond yields alone cannot prove that.
As an illustrative productivity-plus-disinflation case, combine a 5.2 percent nominal yield with the minus 0.1 percent monthly CPI path: the headline proxy reaches 3.77 percent in March and 4.73 percent in April. Those numbers follow from the assumed yield and price path. A productivity announcement would not mechanically produce them.
A 3.0 percent TIPS yield is also not enough, by itself, to enter a band whose lower boundary is about 3.29 percent against the September historical benchmark. The arithmetic should constrain the rhetoric, not the other way around.
Money and velocity: is the money doing more work?
More money does not automatically mean more productivity. The important question is whether the money finances useful investment and more goods and services, rather than just higher prices for stocks, property or everyday purchases.
Velocity is a measure of how much economic activity is supported by a given amount of money. M2 is a broad money measure, and M1 is a narrower one. Comparing their growth with the economy helps us judge whether money is doing more work or whether balances are building faster than spending.
September M2 increased 5.71 percent from a year earlier while the monetary base declined 0.51 percent. Their level ratio was 4.30 times, calculated from the Federal Reserve's October 27 H.6 release. This combines seasonally adjusted M2 with the separately identified NSA base, so the ratio is a descriptive transmission gauge, not a clean causal multiplier.
Comparing the same quarters
For a fair comparison, we use each quarter's average money supply rather than mixing a single month with a full quarter. Nominal GDP means the dollar value of output before removing inflation. The calculation is: one plus velocity growth equals one plus nominal GDP growth, divided by one plus money growth.
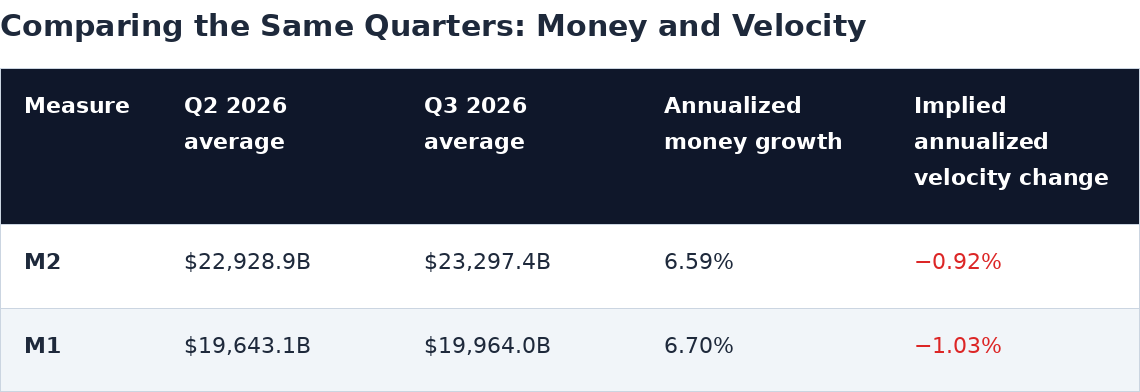
Both measures point in the same direction: balances grew faster than nominal output.
Falling velocity does not automatically mean the economy is getting worse. If inflation slows, people can get more for their money even while the dollar value of spending grows more slowly.
The correct price concept for decomposing nominal GDP is the GDP deflator, not the PCE index. BEA's rounded real and nominal growth figures imply approximately 2.13 percent annualized GDP-price growth. At the calculated M2 growth rate, real growth would need to be about 4.37 percent to hold velocity unchanged.
There is no permanent 4.37 percent hurdle. It changes as money growth changes, and productivity can improve even when velocity falls. We therefore use velocity as a supporting clue, not as a veto on a strong November 5 productivity report.
M1 includes savings deposits within other liquid deposits, so it should not be treated as a pure checking-account turnover gauge. Published velocity series and a recomputation using revised money data should remain separately labeled, rather than being spliced into a misleading trend.
How policy and Treasury financing fit the picture
Our Bessent/Warsh and Colossus ideas describe how government borrowing, confidence in monetary policy and global demand for dollars might work together. They are our explanation of a possible financing strategy, not proof of a secret agreement or a guaranteed ceiling on interest rates.
The basic idea is to connect demand for short-term Treasury bills with efforts to manage longer-term government debt. Stablecoins, digital tokens intended to keep a stable dollar value, could be one channel for that demand. Whether they add genuinely new buying is an important part of the test.
Stablecoin bill demand. The proposed mechanism is that expanding dollar-token reserves create additional demand for short Treasury instruments. The net effect depends on where the funds came from. Money transferred out of existing Treasury-holding funds is not equivalent to entirely new Treasury demand.
Long-bond buybacks. Stronger bill demand could make a maturity shift easier to finance. It does not transform short bills into contractual long-duration funding or eliminate the need to refinance.
The October buyback call. We retain the earlier full-hit test: at least $10 billion per long-bond operation before October 31, continuation beyond November 4, and next-quarter long-bond buybacks at least twice the previously cited roughly $32 billion comparison. This briefing does not score that call as achieved. The qualifying announcement and operating totals remain to be verified.
The discount-buyback scenario. Buying discounted long bonds can reduce outstanding face value while increasing current cash interest if the replacement bills yield more than the retired coupon payments. Face reduction, present-value economics and annual cash-budget savings are different claims.
SuperCoupon. Advertiser-funded purchase incentives remain a proposed adoption accelerator, not evidence of realized stablecoin growth or Treasury financing capacity. Legal treatment and commercial adoption must be established independently.
The main risk is that short-term debt must keep being refinanced. Reliable buyers can make that easier, but money can also leave quickly. Calling it synthetic duration does not make a short-term bill into a long-term loan.
Macro projections and the market path
These are our forecasts and planning scenarios, not facts that have already happened. November 5 is the immediate market test, and the remaining dates describe the larger path we expect or are preparing for.
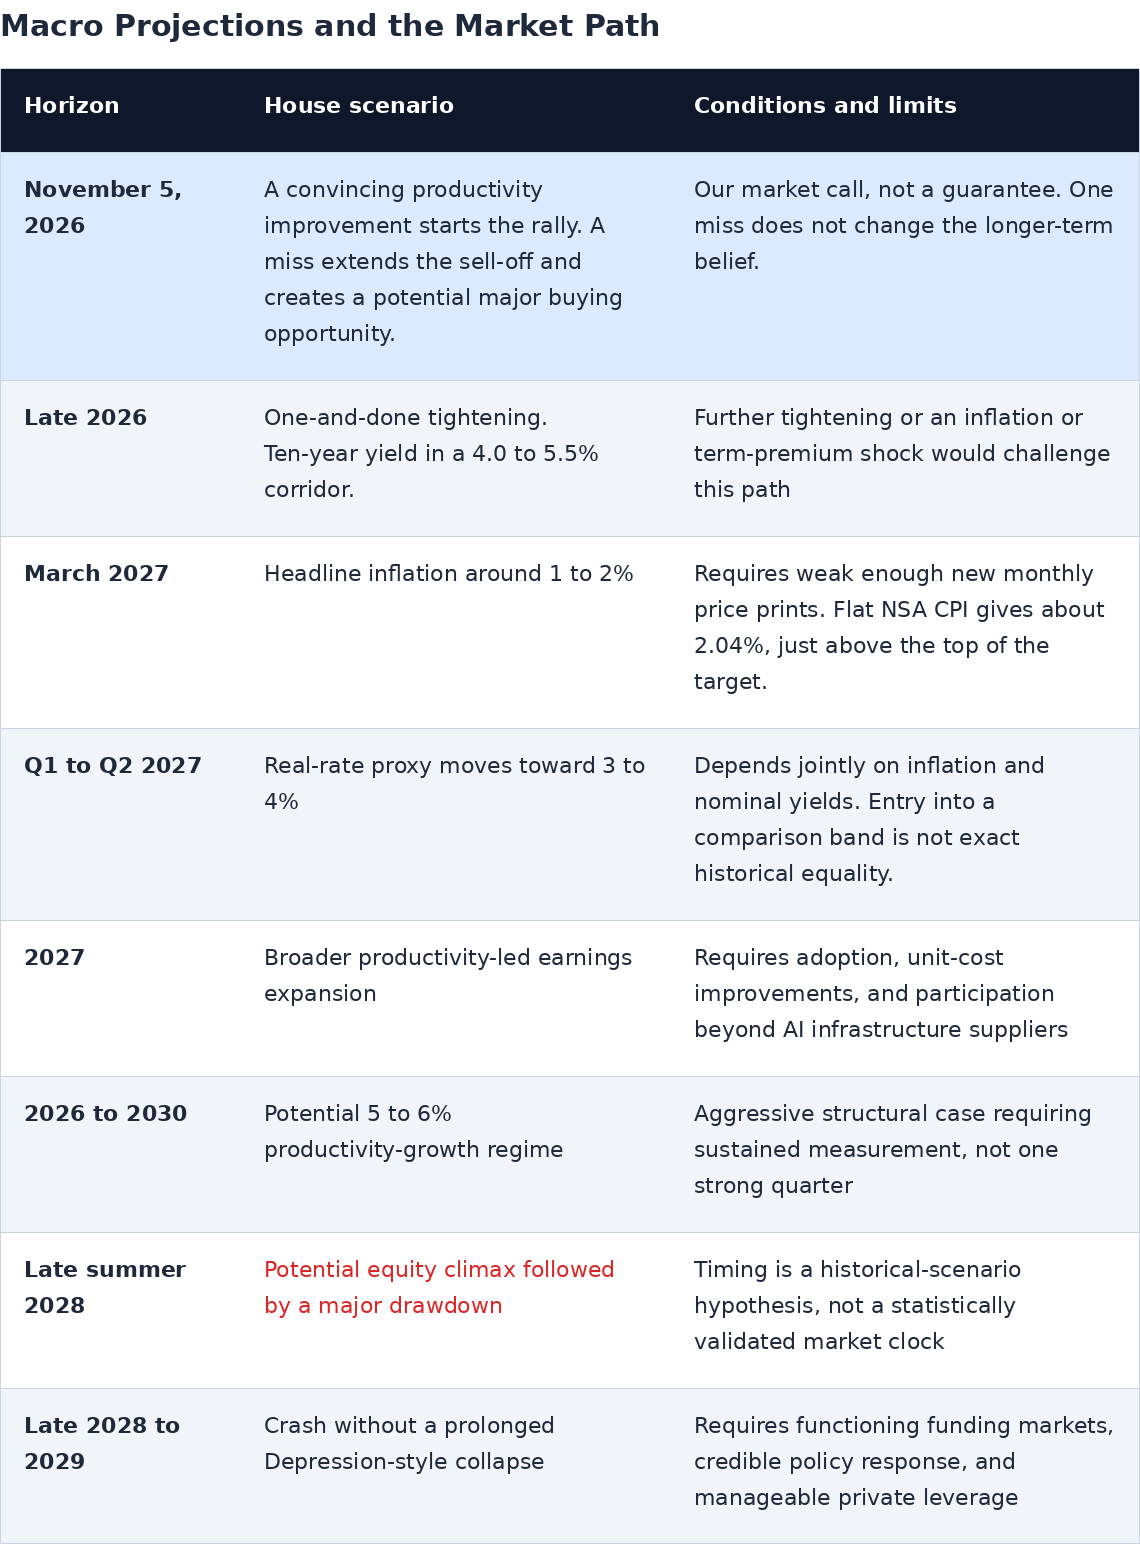
The prior aggressive market scenario envisioned an S&P 500 level around 2.5 times its August 2026 reference by late summer or September 2028, a roughly 50 percent subsequent decline, and recovery to the prior peak by December 2029. That scenario is retained as an outer planning case, not upgraded to a newly validated central forecast by this quarter's data. A 50 percent drawdown would require a 100 percent subsequent gain to recover.
The proposed nominal corridor also needs arithmetic discipline. Combining 1 to 2 percent inflation with 3 to 4 percent real rates permits nominal yields of 4 to 6 percent. The narrower 4 to 5.5 percent corridor therefore requires an additional assumption about the joint path or restraint on the upper tail. It does not follow automatically from adding the two forecast ranges.
What it means for investors
Our preference is for businesses that turn better technology into better results, not simply companies that attach AI to their sales pitch. The attractive business gets more work done, serves customers better and keeps more of each sales dollar as profit.
If November 5 confirms the acceleration we expect, our call is that the rally begins. If it disappoints and the sell-off continues, we would view the decline as a potentially massive buying opportunity rather than abandon the productivity thesis because one preliminary report came up short. That view assumes the weakness is a delay in proof, not evidence of lasting damage to earnings or financing.
Technology users. Seek measurable operating improvement and attractive cash returns. Adoption announcements without evidence of utilization do not settle the investment case.
Technology suppliers. Distinguish growing demand from durable pricing power. A successful technology can enrich its users while competition compresses its suppliers' returns.
Smaller companies and cyclicals. Broader participation would strengthen the thesis, but refinancing exposure and balance-sheet quality remain decisive. High real rates can punish weak borrowers even during a productivity expansion.
Long-term bonds. Lower inflation does not guarantee that long-term bond prices rise if inflation-adjusted yields rise at the same time. Higher interest rates can also reduce what investors will pay for future company profits.
Cash and borrowing. Leave enough room to withstand further declines. A strong long-term view is no help if excessive borrowing forces a sale before it has time to work.
Buy with both hands is a statement of conviction, not a substitute for price, financing discipline or a sell rule. A powerful technology cycle and an expensive security can coexist.
Dates to watch and what would change our minds
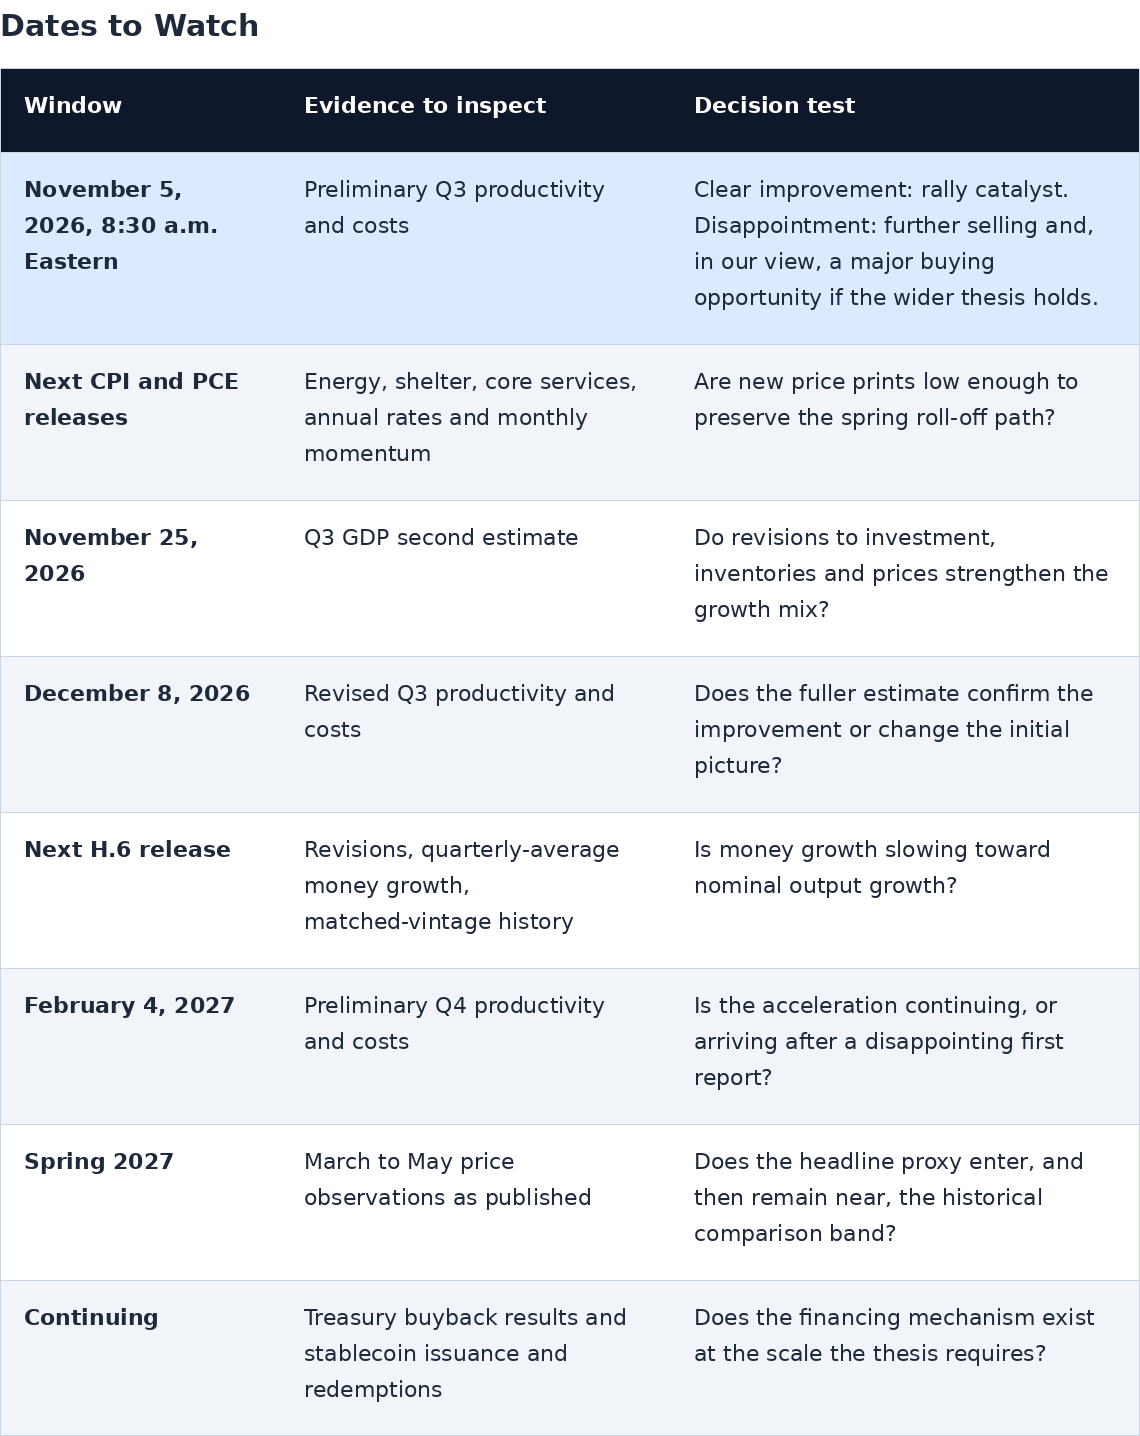
November 5 is the central short-term event. The later reports help distinguish a delayed improvement from a thesis that is failing. Scheduled dates are from the BLS and BEA release calendars, while broader windows identify what we will watch next.
Prices keep rising too quickly. That would delay the inflation improvement. Cheaper energy alone cannot solve lasting price pressure elsewhere.
Productivity repeatedly fails to improve. One disappointing November report would not change our belief. Several weak readings, especially alongside poor business returns, would be a more serious challenge.
Borrowing becomes more difficult. Higher interest rates together with weaker investment and more expensive business credit would challenge the positive interpretation. Higher TIPS yields are not always good news.
The Fed raises rates again. That would break our one-and-done rate call. The latest retrieved policy observation shows a 4.0 percent upper bound on October 28, unchanged from the prior observation.
The proposed financing support does not develop. Shrinking stablecoin balances or too little new demand for bills would weaken that part of the argument. It would need to be judged separately from the productivity story.
Bottom line
November 5 is the next major test, not the expiration date of our conviction. We believe the evidence points toward a significant productivity acceleration consistent with the 99-year clock, and we expect a convincing report to start the rally.
If the improvement is not yet visible, we expect selling pressure to continue and would see that weakness as a potentially massive buying opportunity, provided the broader case remains intact. The distinction is between a delay in recognition and a failure of the underlying idea. One preliminary report can change the first without proving the second.
Data and calculation discipline. This briefing uses information retrieved for the October 30, 2026 preparation date, with observation dates shown where they differ. It does not imply access to an October 30 market close. Real-rate scenarios compound the September NSA CPI index against the relevant prior-year month and subtract the resulting inflation rate from the assumed nominal yield. Money growth uses quarterly averages from one H.6 release, and velocity growth uses rounded BEA nominal-growth data, so calculated estimates may differ slightly from an official series built from unrounded levels. Historical yield comparability, absent CPI observations, seasonal adjustment, data revisions and the house-defined alignment tolerance remain explicit limitations. Data are drawn from the BLS, BEA, the Federal Reserve's H.6 and H.15 releases, and FRED.
This is a strategic macroeconomic briefing, not individualized investment advice or a recommendation to buy or sell any security. The November 5 market call, the price paths and the projections are house scenarios and may prove wrong. The SuperCoupon referenced in the financing section is a product of BCII Enterprises, whose co-founders have a direct commercial interest in its adoption.