The Case for a Warsh Hold and a March Cut


A Bessent/Warsh Accord research note, with a companion review of the non-US deflation evidence: commodities, money, bank lending and consumer prices across 36 economies.

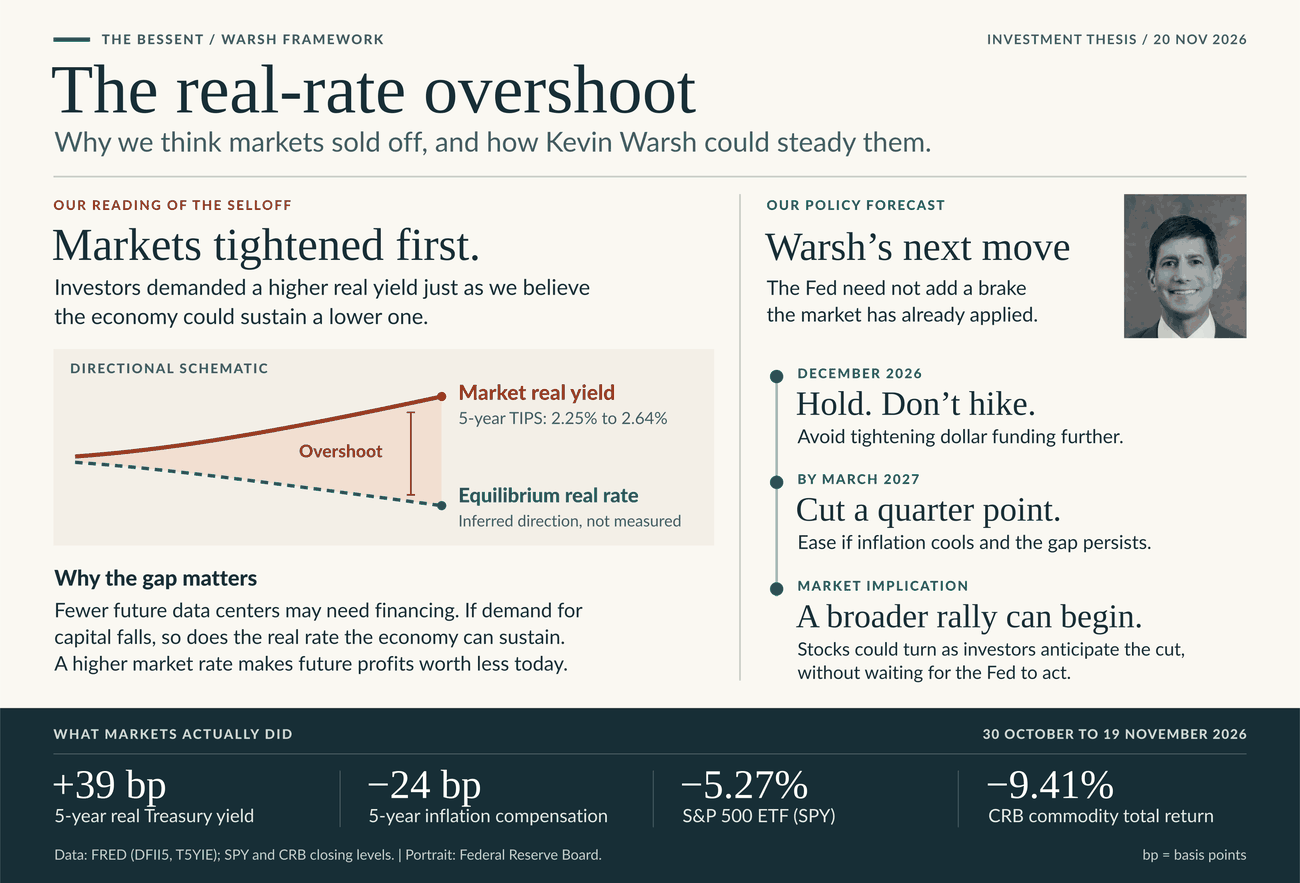
The call is a hold on December 9, another hold in January unless conditions deteriorate, and a first quarter-point cut by March 17, 2027, on the Federal Reserve's meeting calendar. Three things can be true at once: a small firm can get more work out of the AI capacity already installed, the next data center planned for 2029 to 2030 can be harder to justify, and foreign markets can become less able to absorb another shift of savings into dollars. In that setting the market can demand a higher real yield precisely when the economy can sustain a lower one. That is a reason for Warsh to hold and then cut without either rescuing stockholders or declaring an end to the AI boom.
November changed the evidence
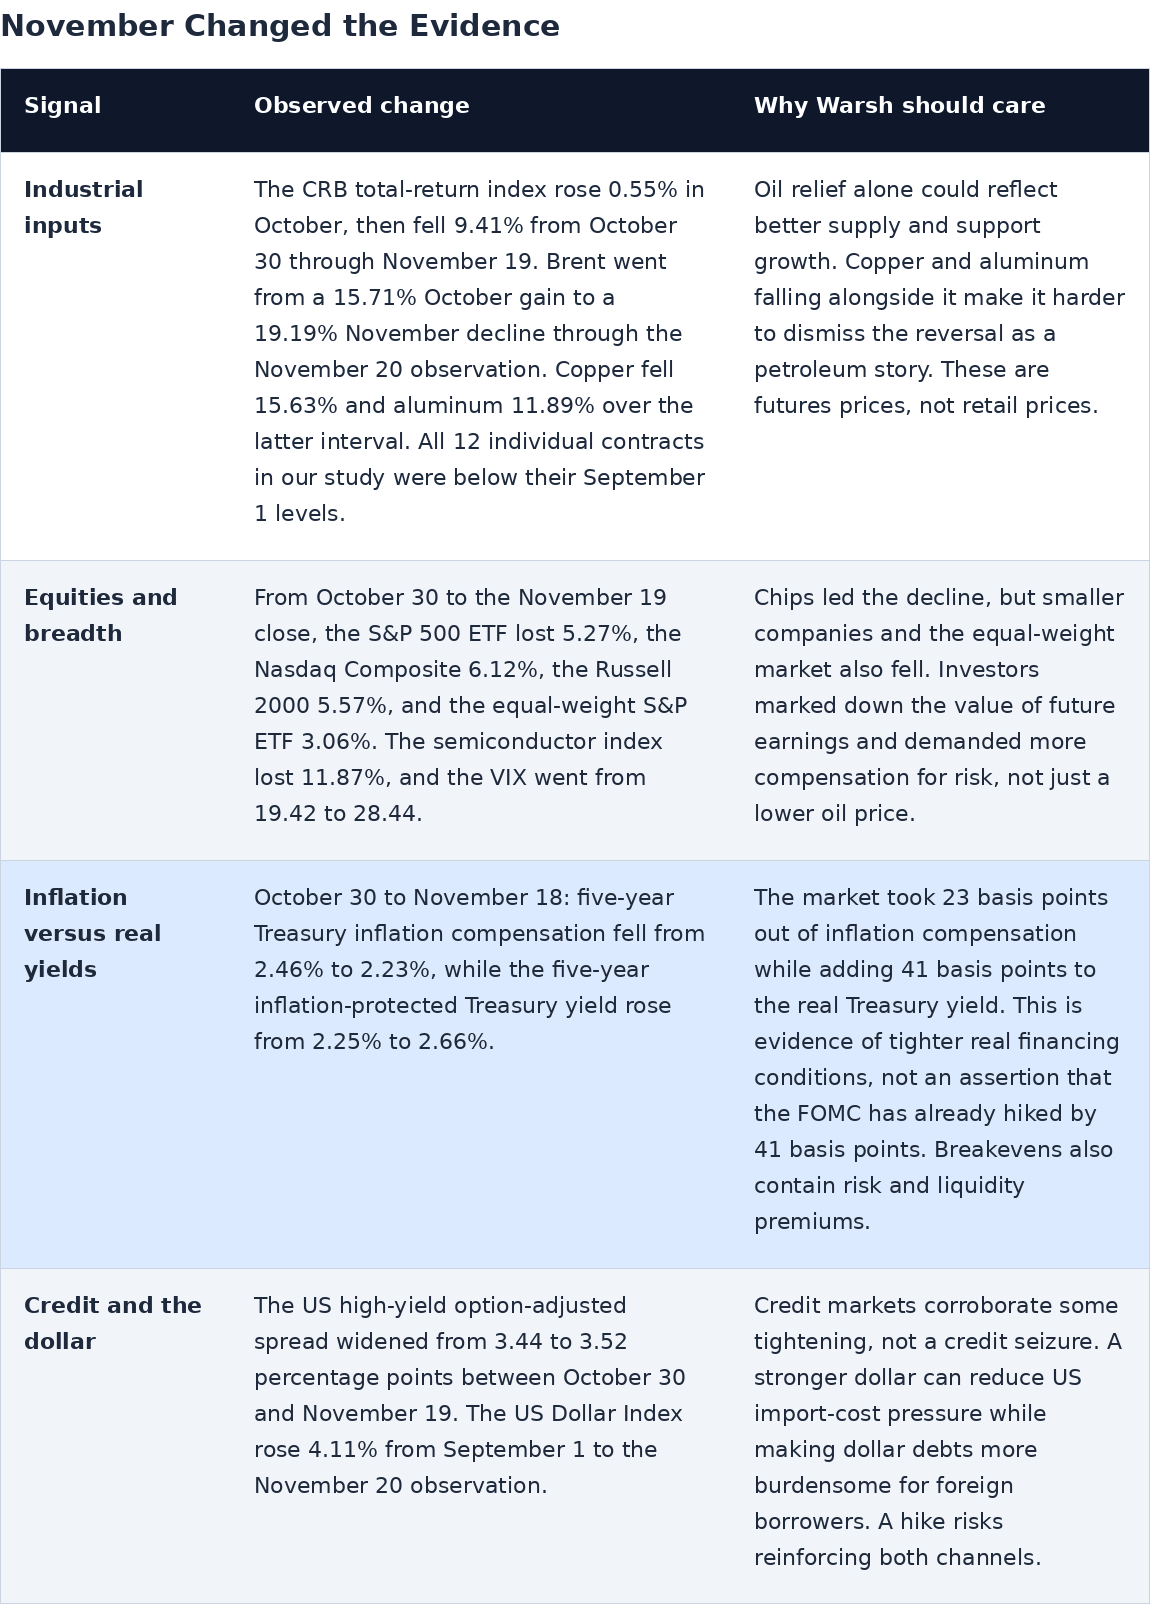
These comparisons use price returns, not dividends. The equity comparison uses the November 19 close to match the endpoint of the broad commodity index. No November 20 intraday equity observation is presented as a closing price.
Why the Bessent/Warsh Accord matters
The Accord is our name for an institutional division of labor, not a claim that Treasury and the Fed signed a policy pact. With President Trump's signature on the GENIUS Act, Bessent explicitly connected wider foreign access to dollars with greater demand for US Treasuries in his statement on enactment. In our original discussion, the point was that foreign savers wanting usable dollars can support recurring demand for short Treasury paper. If dollar stablecoins grow and issuers hold bills as reserves, Treasury gets buyers that can keep rolling short maturities. That does not make a bill a long bond: rollover risk and exposure to the next short rate remain with Treasury.
There are observable parts on both sides. The GENIUS Act requires eligible reserves, permits short Treasuries alongside other liquid assets, and bars issuers from paying interest merely for holding a payment stablecoin. A BIS study finds that stablecoin inflows can lower bill yields, with limited spillover to longer maturities. Separately, Treasury's November refunding provides for up to $70 billion of liquidity-support buybacks across maturities, and its operation schedule includes individual 20-to-30-year operations capped at $6 billion. Treasury continues to issue long bonds. These are liquidity operations, not Fed quantitative easing or proof that stablecoin proceeds fund particular buybacks.
"Only the accelerator" is an argument about what the Fed can control. Warsh and the FOMC can raise borrowing costs; September demonstrated that. They cannot, by raising the policy rate, order foreign dollar holders to redeem privately issued tokens. If bill yields follow the policy rate higher, issuers can earn more on their reserves even as ordinary borrowers pay more and foreign banks face competition for deposits. Whether token demand actually grows is a separate question. In our brake-and-accelerator formulation, a hike can hit the borrower harder without reliably slowing the dollar flow it was supposed to restrain. A cut, by contrast, can deliver identifiable relief to short-rate borrowers as their debts reset. The BIS analysis of bank funding and stablecoin reserves explains why the two effects need not cancel out.
The constraint on the next dollar is abroad. The Accord does not need an ever-faster inflow to keep working. Our reading of November is that pushing for more now risks tipping the markets supplying the funds. A saver who exchanges a local bank balance for a dollar claim gains dollar access; if the local bank loses funding it cannot cheaply replace, a local business may lose credit. Weaker foreign demand can then reach the US through fewer export orders and more aggressive pricing by foreign producers. The dollar's rise alongside falling industrial metals, falling small-cap equities and higher real yields is the warning. Those prices do not identify stablecoins as the cause or reveal a precise breaking point. To test proximity to that point, look for sustained net flows into dollars alongside foreign deposit losses and a widening premium to borrow dollars through FX swaps. If foreign bank funding remains readily available, the tipping-point argument weakens, as BIS work on cross-border dollar claims and Fed research on international policy spillovers both suggest.
The fundamentals give Warsh room to wait
Overseas demand has weak spots, not universal deflation. In China, October industrial output rose 4.8 percent year over year against just 0.4 percent growth in nominal retail sales. M2 rose 7.14 percent, but household loans outstanding fell 2.11 percent. Industrial capacity can keep growing even when the domestic buyer is weak, creating an incentive to compete harder on export prices. China's reported producer prices still rose 5.7 percent year over year: export discounting is a prospective mechanism, not proof of a nationwide factory-price collapse. Japan's monetary base fell 13.6 percent year over year and the euro area's fell 10.3 percent in their respective latest observations, even as bank lending grew. Across our panel, real broad money fell in 10 of 32 comparable economies; none of the 36 had negative annual headline CPI, and in 20 of 34 matched economies inflation had accelerated. The case is about what the market is anticipating, not what all countries have already reported. The companion note below sets out the country, credit, currency and commodity evidence.
US output is rising without a corresponding rise in hours. Third-quarter nonfarm business output rose 3.7 percent annualized on just 0.1 percent more hours, on BLS data. Productivity rose 3.6 percent and unit labor costs fell 0.7 percent, even though hourly compensation rose 2.9 percent. Unit labor costs were still up 2.4 percent over four quarters. In the same quarter, core PCE inflation slowed to 2.5 percent annualized from 3.3 percent, BEA reported. The distinction is crucial: stronger supply allows activity to grow without requiring the Fed to suppress demand at the same time.
Warsh is listening to the people who see the smallest firms early. On November 16 he personally moderated the Fed panel where Stripe CEO Patrick Collison contrasted startups' willingness to deploy AI agents with incumbents' caution. Affirm CEO Max Levchin also discussed the prospects for one-person businesses. Stripe's own data presentation describes new firms growing revenue faster while keeping headcount lean for longer. That documents Warsh's exposure to the mechanism, not a claim that he cited a particular microbusiness index.
The 0-to-10-employee hypothesis has a measurable core. In QuickBooks' measured US group of one to nine employees, October real revenue per business rose 2.60 percent while segment employment fell 0.14 percent; neither zero-employee firms nor firms with exactly ten employees are in that index. Nonemployer firms are covered separately in annual Census data. An owner who serves another customer without hiring a tenth employee, or who stops buying an outside bookkeeping service, can raise output before any consumer price falls. In Citizens' separate survey, 94 percent of regular, multi-function AI users reported cutting spending on at least one outside service, and 38 percent cited bookkeeping or accounting. These observations are consistent with AI productivity, not an AI-attributed estimate of output per hour. Cisco's workforce-wide rollout illustrates the large-company counterpart, where installation costs can come first.
Consumer prices are the lagging test. October headline CPI rose 0.4 percent after 0.6 percent in September, and core rose 0.3 percent again, on BLS data. Core goods rose 0.2 percent and services excluding energy rose 0.3 percent. A November collapse in input prices could not have appeared in October's shopping basket. November CPI is scheduled for December 10, the day after the FOMC decision.
Why the market real rate can overshoot in years three and four
Our earlier real-rate paper argued that Treasury had to compete for capital with data centers promising unusually high returns. The change now is not that AI has stopped paying off. It is that a lender financing the next campus must underwrite its signed tenants, utilization, power commitments and future compute prices, not the returns earned by the first campus. If more users can be served cheaply on existing capacity, or if fewer customers will commit to the next build at the original price, the expected return on that build falls. Microbusiness adoption can strengthen even as the demand for additional construction capital weakens.
There is concrete evidence for treating the out-years differently. In a November 18 letter, state consumer advocates told PJM that the power forecast for the 2029 to 2030 delivery year included canceled data centers and projects unlikely to reach their forecast load. They requested a postponement of the capacity auction, not a finding that aggregate compute demand was falling. On November 19, Rystad Energy projected about 49 gigawatts of US capacity additions in 2029 to 2030 against 191 gigawatts announced for those years. That gap includes execution, power and permitting constraints; it is not 142 gigawatts of canceled orders. The demand-side test is whether signed leases, reservations backed by deposits, and financed construction starts also fall short, not merely whether a press release slips a year.
The rate that borrowers face can move above the rate the forward economy can sustain. At the same five-year maturity, inflation compensation fell from 2.46 percent to 2.23 percent while the real Treasury yield rose from 2.25 percent to 2.66 percent between October 30 and November 18. The ten-year real yield also rose, from 2.60 percent to 2.88 percent, on FRED data. A TIPS yield is already a real yield: subtracting inflation from it again would double-count. The separate, unobserved comparison is between that market cost of capital and the real rate justified by prospective saving and investment. If disinflation makes a fixed nominal policy rate more restrictive and weaker years-three-and-four projects reduce the economy's demand for capital, those two rates can move apart. The claim is not that 2.66 percent proves the neutral rate is lower; it is that, in this scenario, another Fed hike would widen a gap that is already opening.
From no action to acceleration
December 8 to 9: hold at 3.75 to 4.00 percent. The September hike is still passing through to borrowers. November's repricing gives Warsh a reason not to add another hike without declaring victory over inflation. The best objection is serious: almost all October participants expected further increases under their baseline outlook, and the December prediction market strongly favored a hike on November 20. But the minutes describe an October baseline. They also record concern about tighter credit for some borrowers and the financing of AI investment. The argument for a hold is that those conditions have changed since the meeting, not that the market or the Committee was unaware of inflation.
January 26 to 27: use the data, not a promise. A second hold gives the Committee time to see whether lower energy and materials costs reach nonfuel imports and core goods, and whether hiring, hours and underlying services inflation cool. It also lets us test the Accord itself. Treasury identifies January 18 as the Act's expected effective date, so look for net stablecoin issuance and reported bill holdings, rather than assuming that signing the law guaranteed new flows. Resilient real output with falling unit costs would be evidence of stronger supply, not necessarily a reason to hike. Warsh is already investigating that distinction: in his November 16 speech, he took AI's productive potential seriously without claiming a structural breakout was already proven.
By March 16 to 17: cut 25 basis points if the gap persists. That would move the target to 3.50 to 3.75 percent. The affirmative case is that small firms are producing more per dollar of labor and outside services, forward data-center commitments no longer justify the earlier competition for capital, and foreign dollar funding is becoming harder, not easier. If those signals persist and underlying inflation cools, a modest cut relieves short-term borrowers without requiring a recession or negative headline CPI. It is not a forecast that a quarter-point cut will pull long Treasury yields down by the same amount. Conversely, if signed out-year leases and financing strengthen, foreign funding stress subsides, and services inflation or unit labor costs reaccelerate, the case for a March cut weakens. A December hold can still have been right even if March becomes another hold.
Conclusion: the 99-year clock still turns on the real rate
We believe the September hike was the last one in this cycle. We expect Warsh and the FOMC to hold in December, cut a quarter point by March 2027, and see the broad US equity market rally as investors anticipate the change. That is the sequence we laid out in our 99-year-clock paper. The historical parallel is a way to ask what return the economy can sustain, not a claim that a calendar can predict the Fed.
The blue political wave and the loss of Jensen Huang, a principal architect of the AI buildout, changed the odds for the 2029 to 2032 projects that still need tenants, power and financing. The election put more of the cost of grid expansion in play for developers, Rystad Energy noted. NVIDIA's board accepted Huang's resignation on November 11 after meeting to consider his ouster, according to its SEC filing and Reuters, and AI-linked shares sold off when his departure became public. The market reaction is observable; our judgment is that investors are less willing to finance distant projects on the strength of a growth forecast alone. Our concern extends the documented 2029 to 2030 planning risk into 2031 to 2032; it is not a report of cancellations in those later years. NVIDIA has continued to make supply commitments, and a small firm can profit from the machines already installed even if the next campus never gets built.
It is still about the real rate. Our earlier real-rate analysis argued that Treasury had to offer more to compete with high expected returns on data centers. That argument works in reverse: fewer attractive projects mean less competition for the next dollar of capital. We therefore believe the sustainable real rate is falling alongside prospective inflation, but for different reasons: weaker investment demand lowers the first, while cheaper inputs and higher output per hour restrain the second. Markets have not fully converged to that outlook. From October 30 to November 19, five-year inflation compensation fell from 2.46 percent to 2.22 percent while the five-year real Treasury yield rose from 2.25 percent to 2.64 percent. That gap is the reason to ease: holding the nominal policy rate fixed as expected inflation falls makes borrowing more restrictive just when the forward economy warrants less restraint.
Why a rally rather than a recession trade? We expect the gains from cheaper AI to reach businesses that use it even as returns fall for some companies that build it. If Warsh declines to hike while output per hour continues to rise, investors can begin to discount future earnings at a lower rate without cutting those earnings forecasts by an equal or greater amount. The rally can therefore start with the hold, before the first cut, and need not be led by the infrastructure stocks that fell first. A collapse in earnings or a resurgence in underlying inflation would break that logic. Our call is the opposite: disinflation with productivity growth, a hold followed by a cut, and a broader equity rally.
Companion note: the non-US deflation test
Commodities, money, bank lending and consumer prices, September 1 through November 20, 2026. Monthly macro observations and daily commodity benchmarks. The United States is excluded from the country analysis.
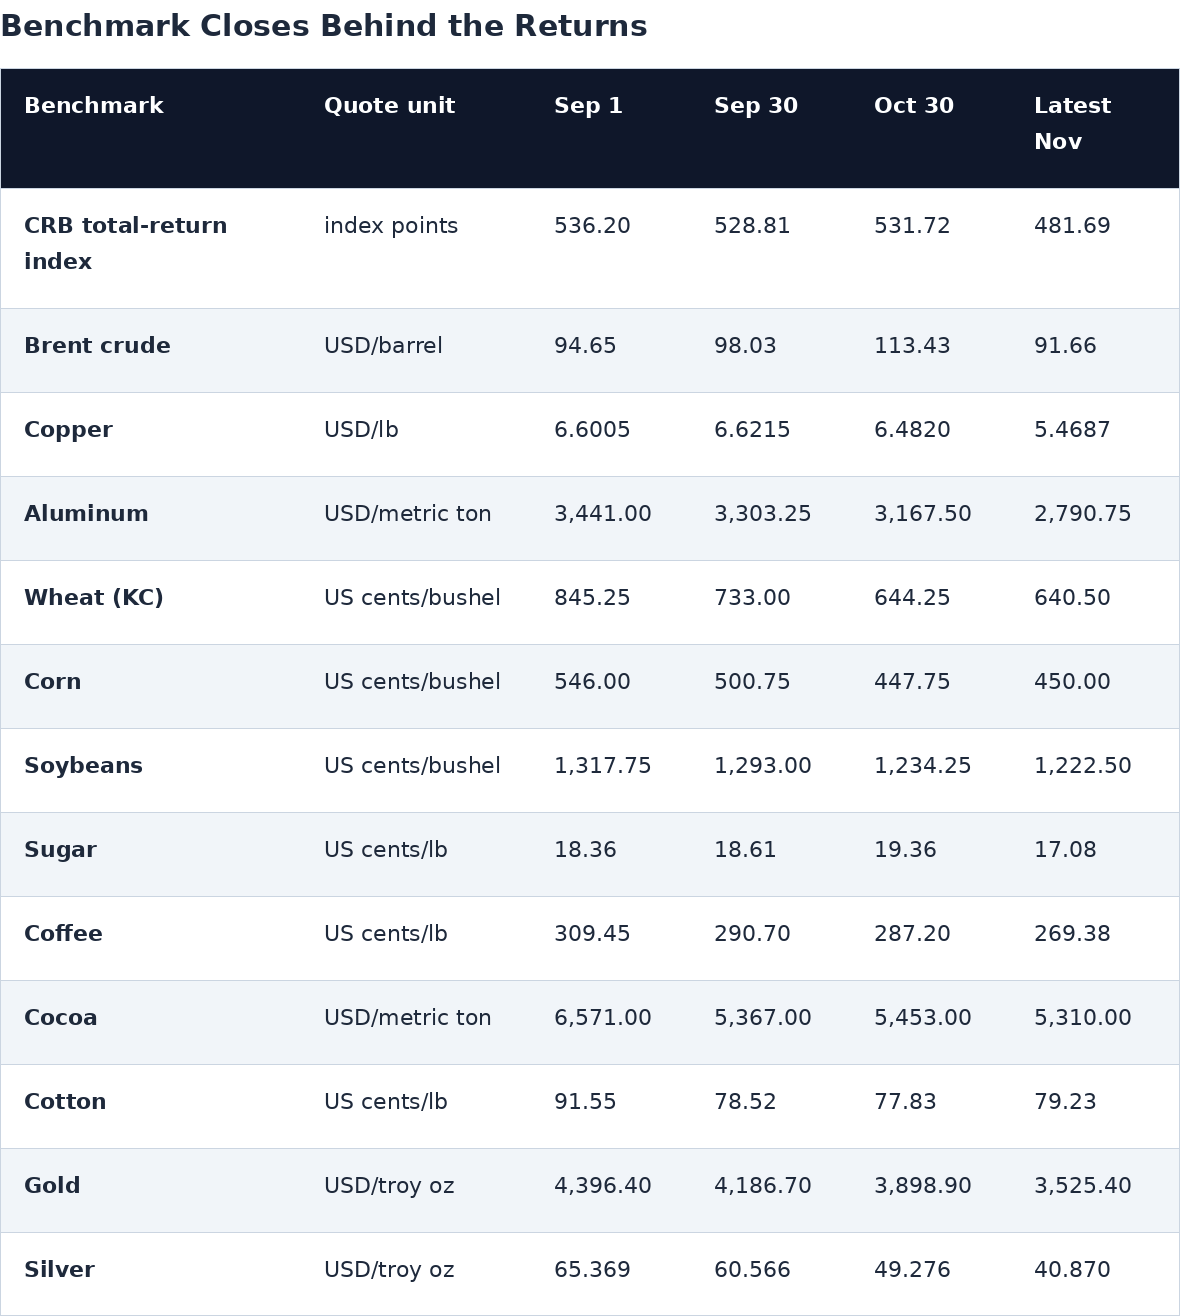
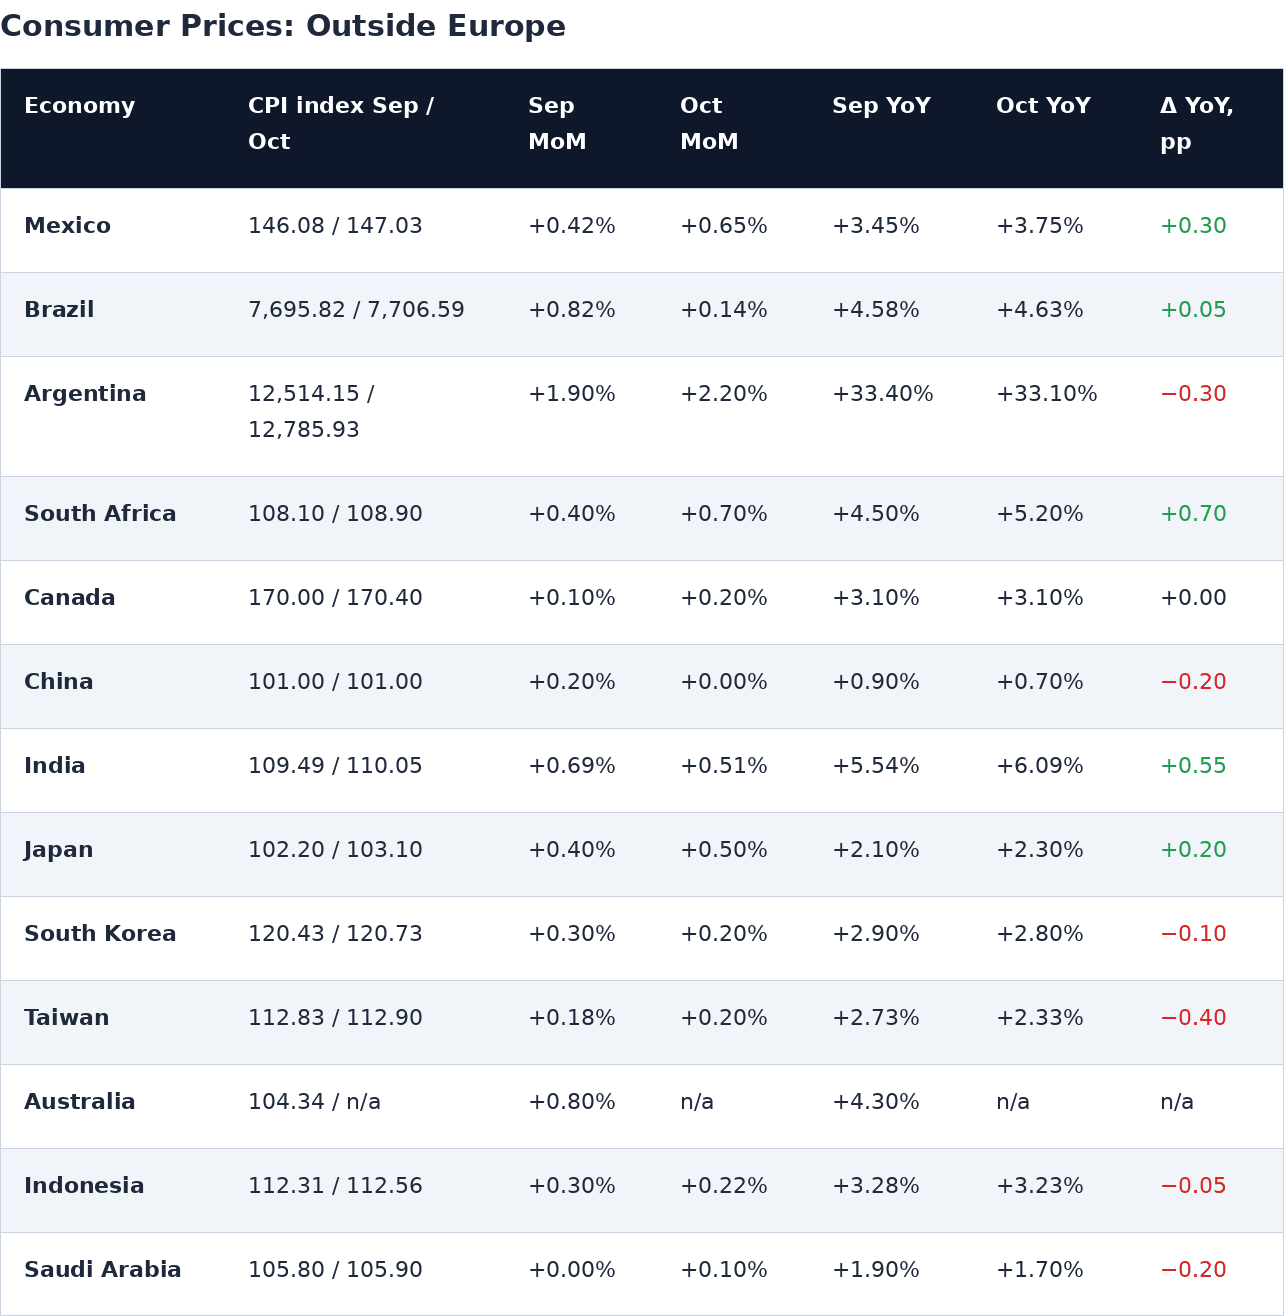
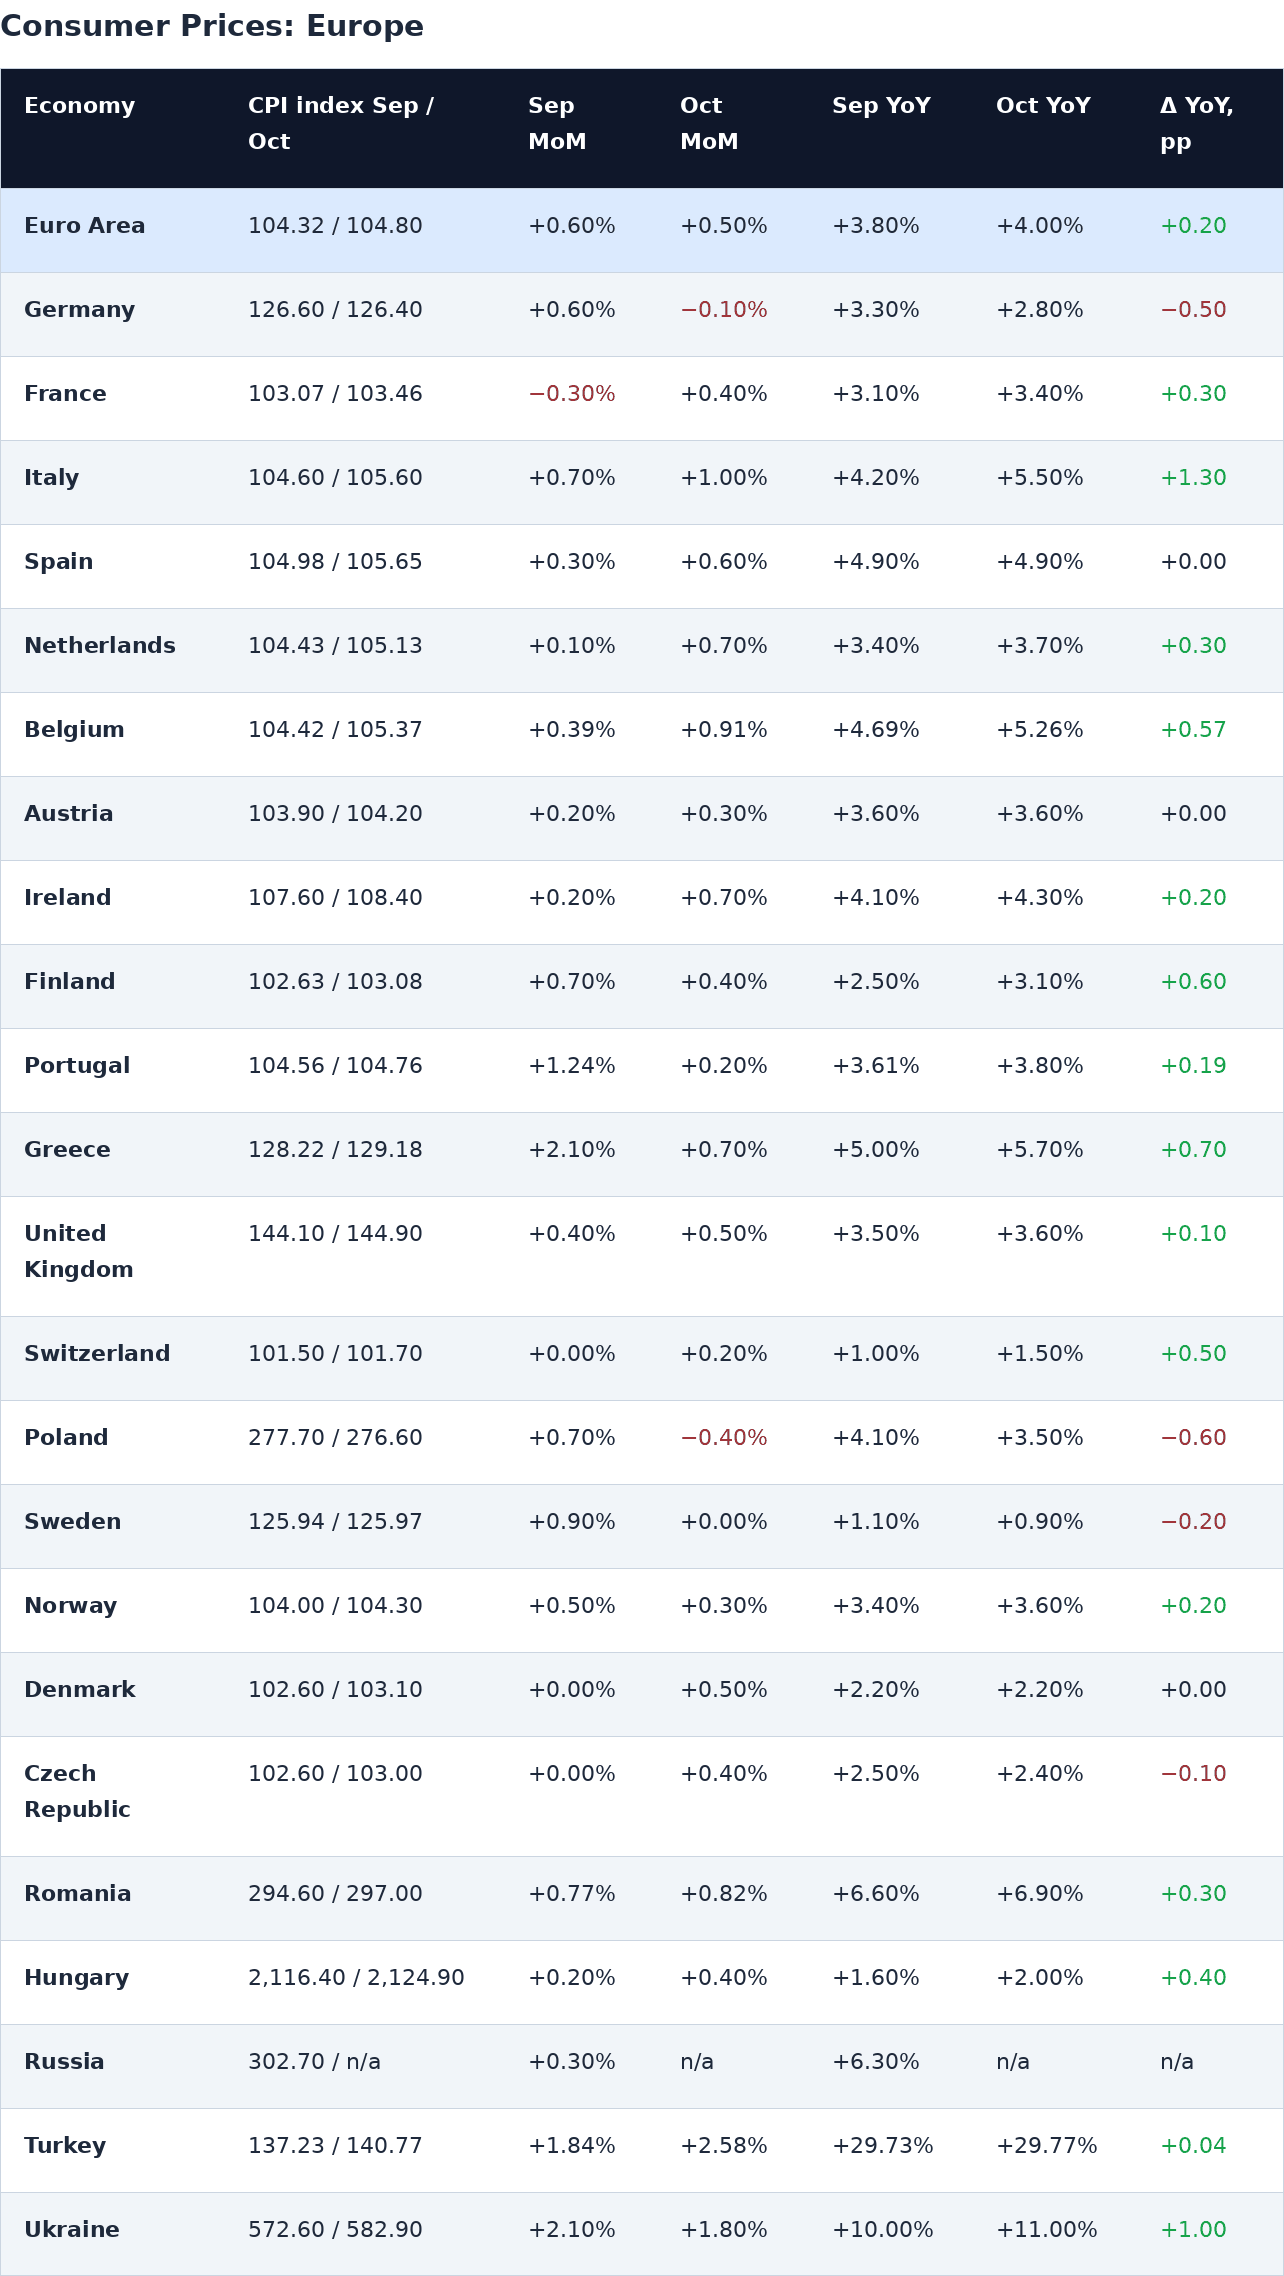
The price signal is strongest upstream. The CRB total-return index fell 10.17 percent through November 19, and all 12 individual futures benchmarks finished below their September 1 levels through November 20. In contrast, none of 36 economies had negative annual headline CPI at their latest observation. From September to October, annual inflation rose in 20, fell in 10, and was unchanged in 4 of the 34 countries with both readings. These are equal-country counts, not a GDP-weighted inflation index.
What the evidence says
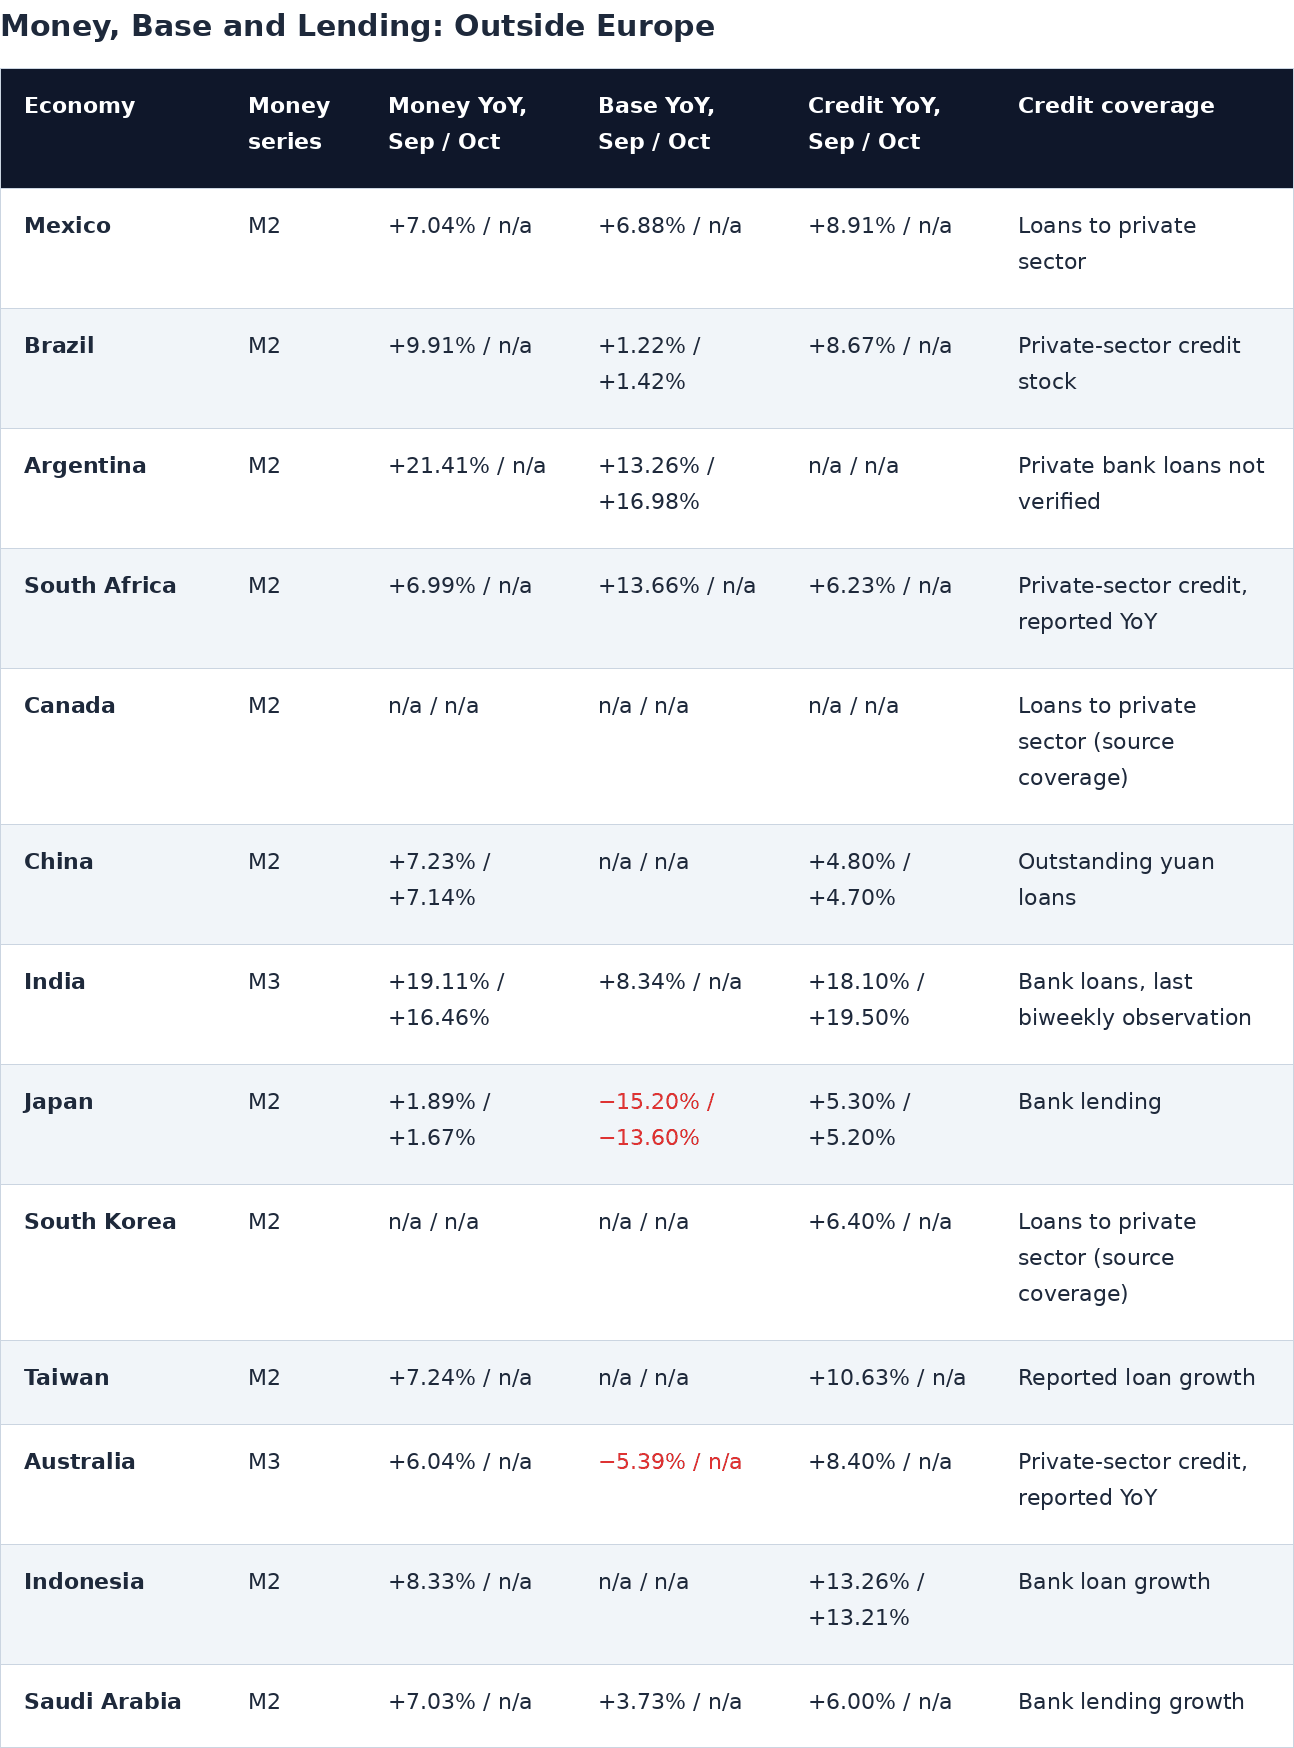
China: weak household borrowing despite growing money. October M2 grew 7.14 percent year over year. Outstanding yuan loans grew 4.70 percent, but the household loan stock fell 2.11 percent year over year, and headline CPI slowed from 0.90 percent to 0.70 percent. This is a meaningful domestic demand warning: the weak point is household borrowing, not the total stock of money.
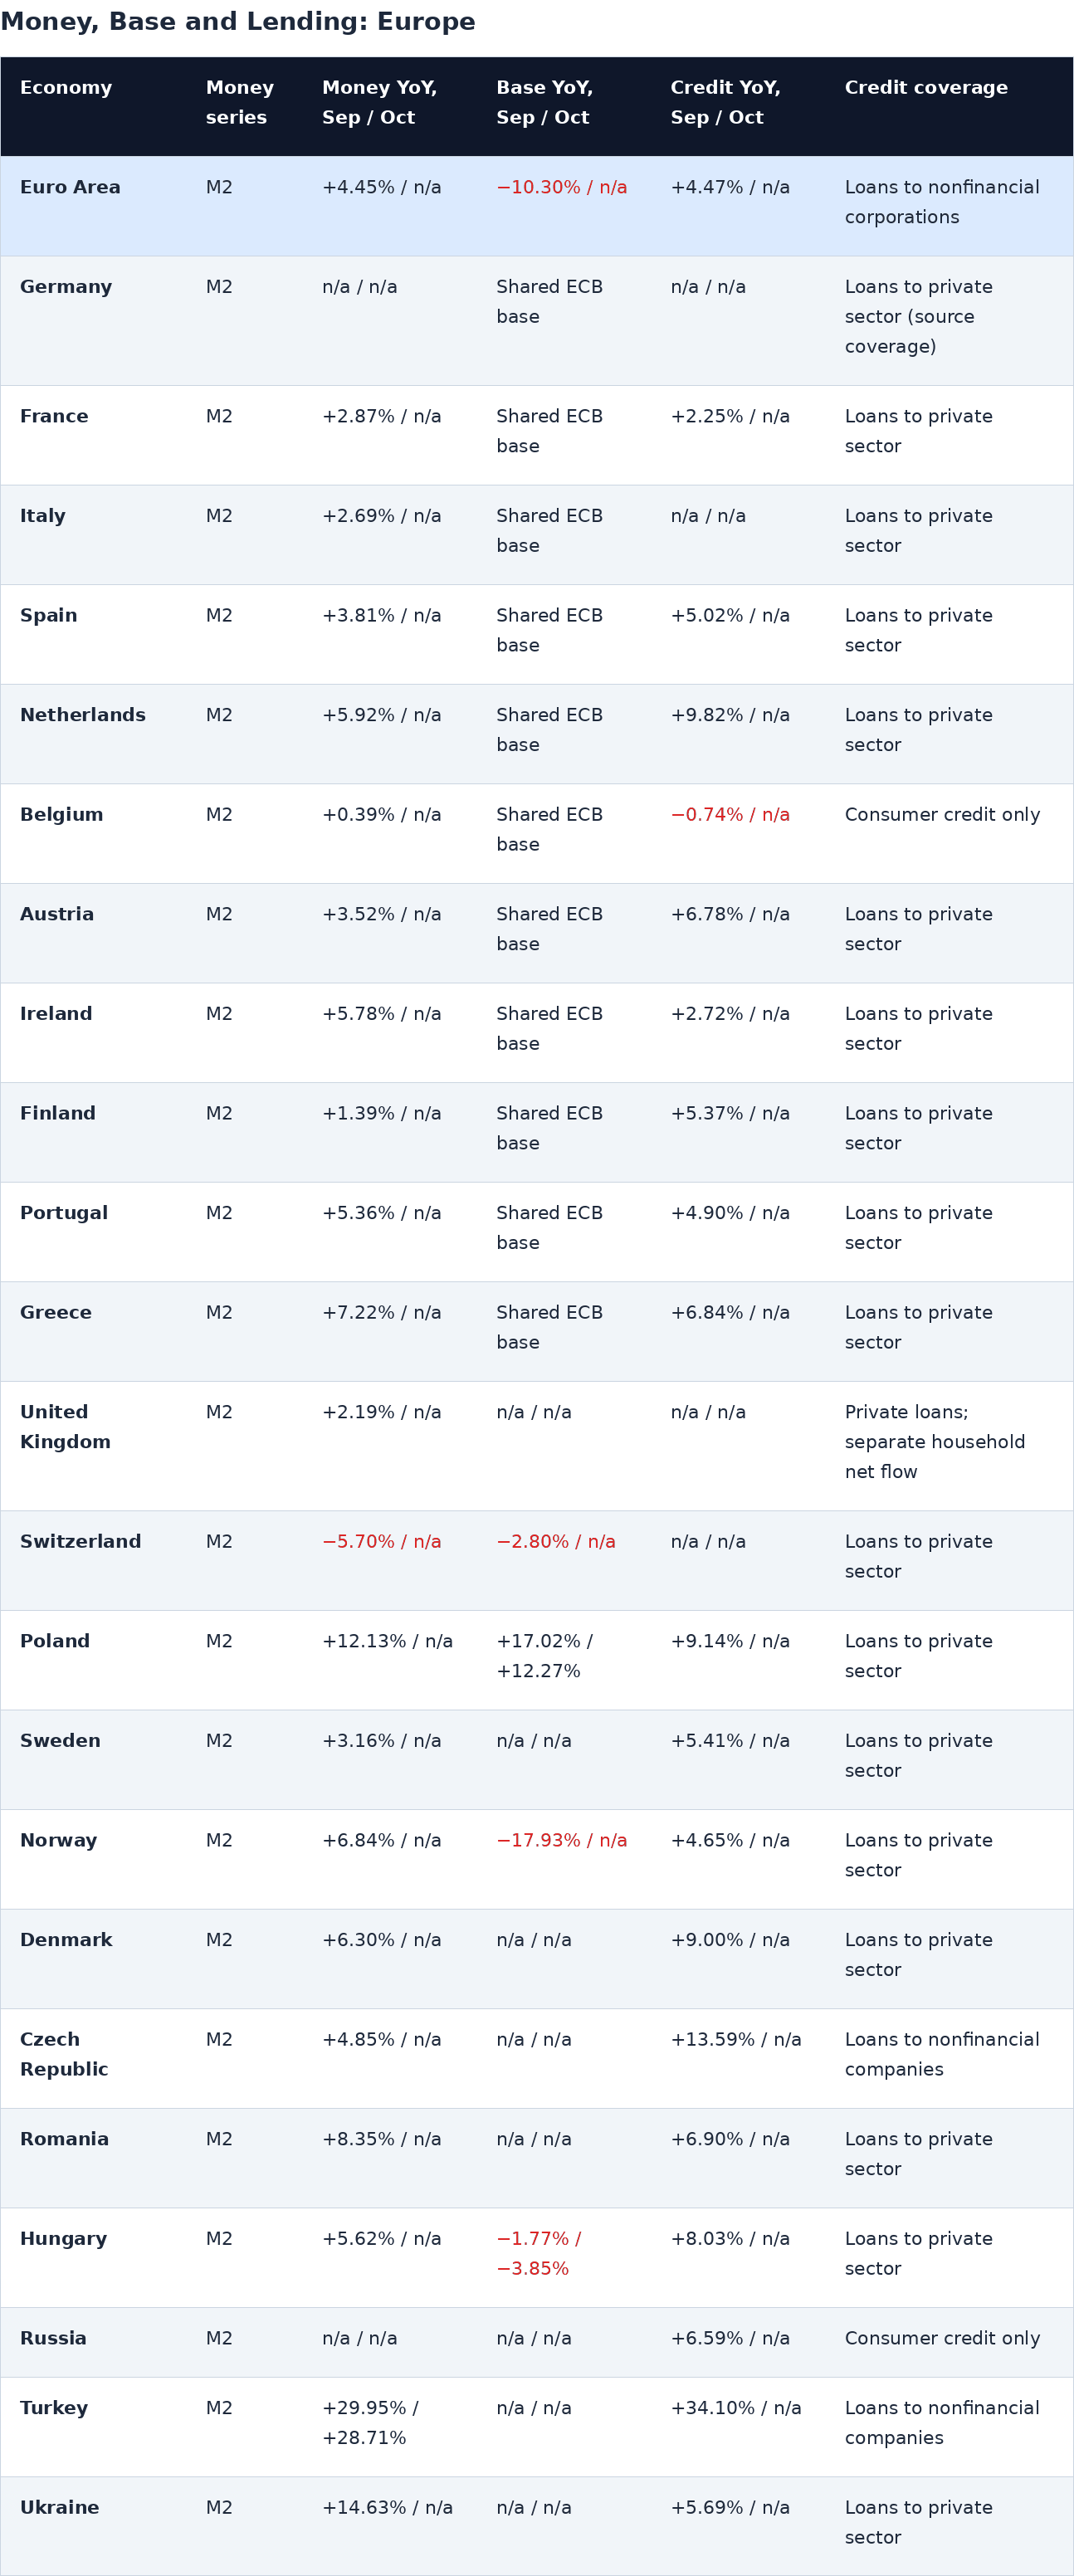
Japan and the euro area: the base and bank credit moved in opposite directions. Japan's October monetary base fell 13.60 percent year over year, while M2 rose 1.67 percent, bank lending grew 5.20 percent, and CPI inflation reached 2.30 percent. In the euro area, September base money fell 10.30 percent while M2 rose 4.45 percent, nonfinancial corporate loans rose 4.47 percent, and household credit grew 3.10 percent. Reserve contraction is evident; a concurrent collapse in bank money and lending is not.
Switzerland and Argentina: monetary pressure of different kinds. Swiss September M2 fell 5.70 percent and the base fell 2.80 percent; October CPI inflation nonetheless rose to 1.50 percent. Argentina's September M2 rose 21.41 percent nominally, but prices rose 33.40 percent, implying minus 8.99 percent real M2 growth. Falling real balances can constrain spending without implying falling nominal consumer prices.
India, South Africa and Australia: counterexamples to synchronized tightening. India's October bank-loan growth was 19.50 percent alongside CPI inflation of 6.09 percent. South African September private-sector credit grew 6.23 percent, while October CPI reached 5.20 percent. Australian September private-sector credit rose 8.40 percent with CPI inflation of 4.30 percent.
Breadth of credit. All 28 countries with a usable September bank-loan or private-credit growth series showed positive annual growth. This is a matched-month, unweighted direction count, not a claim that the underlying credit definitions are identical. Consumer-credit-only proxies, missing economies and the euro-area aggregate are excluded.
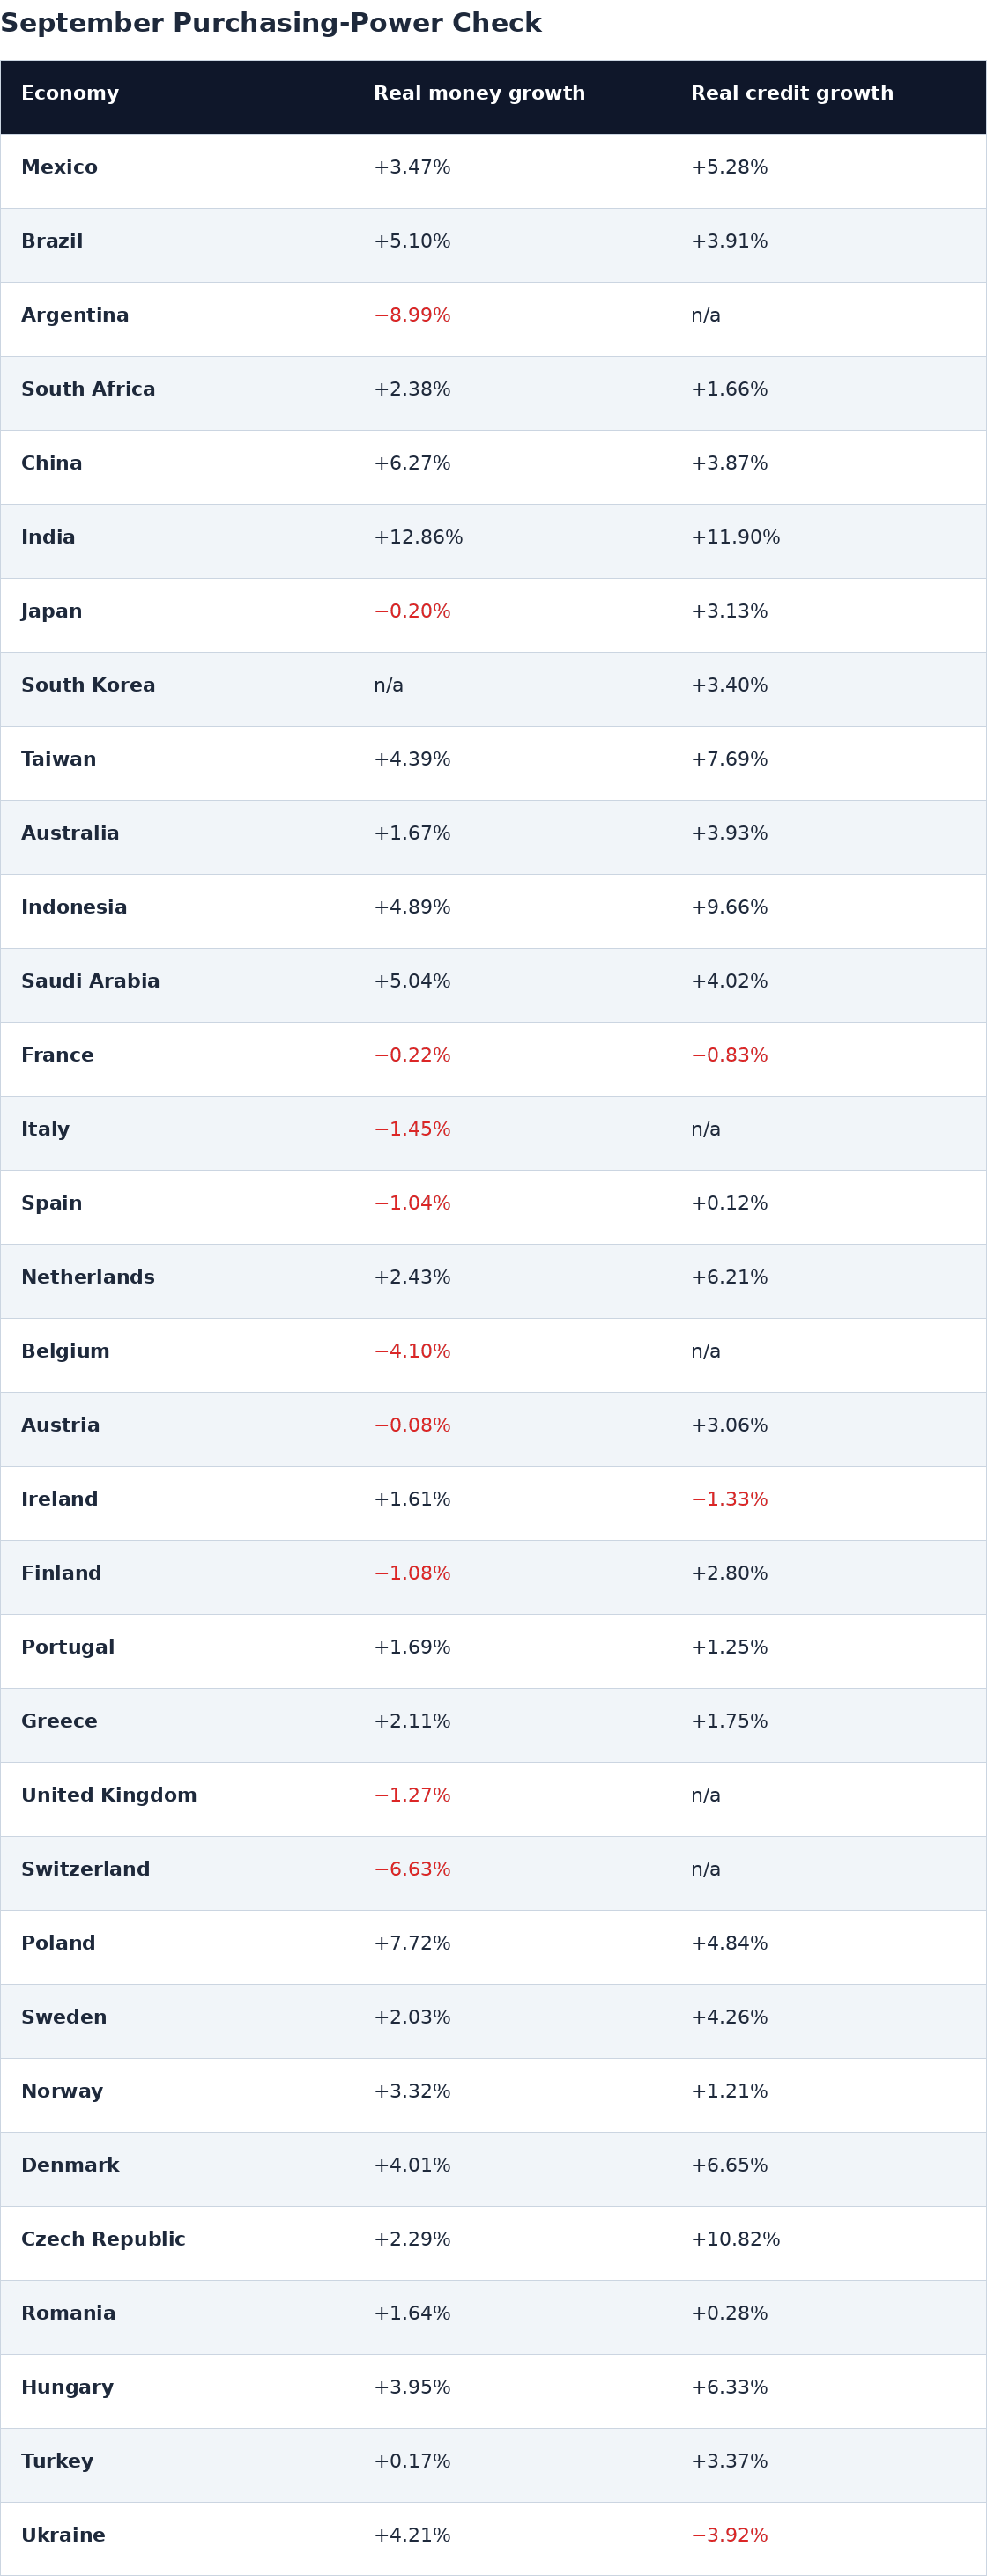
Purchasing power of money and credit. After adjusting for each country's own September CPI, broad-money purchasing power fell in 10 of 32 comparable economies. The largest declines were Argentina at minus 8.99 percent, Switzerland at minus 6.63 percent and Belgium at minus 4.10 percent. Private credit grew in nominal terms in every country in the matched bank-credit sample, but its value after inflation fell in 3 of 28: Ukraine, Ireland and France. This is a more sensitive warning of pressure on spending than waiting for headline CPI to turn negative; it is not evidence that falling money caused the price moves.
Commodity markets: where prices actually fell
Returns are changes in the published benchmark closes, not inflation rates. September starts at the September 1 close, October ends October 30, and November is month-to-date. The CRB observation stops November 19; all individual contracts stop November 20. Futures can change when the quoted contract rolls, and the CRB total-return series also includes the economics of futures investment, so it is not a physical spot-price index, under the FTSE/CoreCommodity methodology.
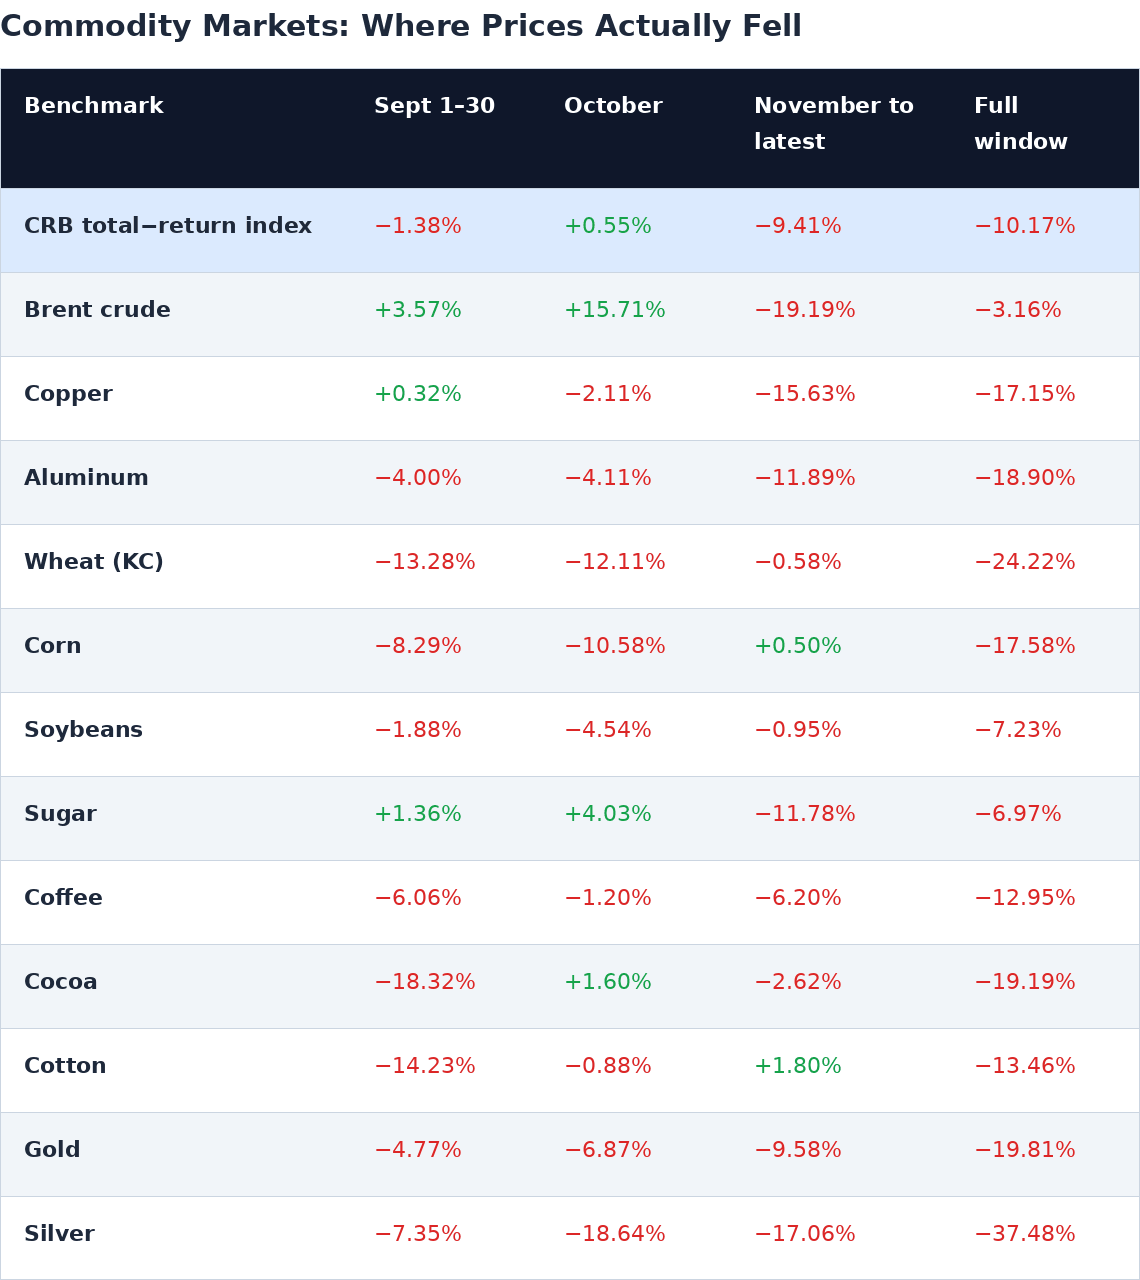
Brent rose 15.71 percent in October, then fell 19.19 percent in November to date. Copper, aluminum and grains give a stronger cross-check on industrial and food costs than gold or silver alone. Global benchmarks are included regardless of exchange location; no US national CPI, credit or monetary data enter the analysis. The basket does not cover every commodity, notably European gas and iron ore.
Factory-gate check: did commodity declines reach producers?
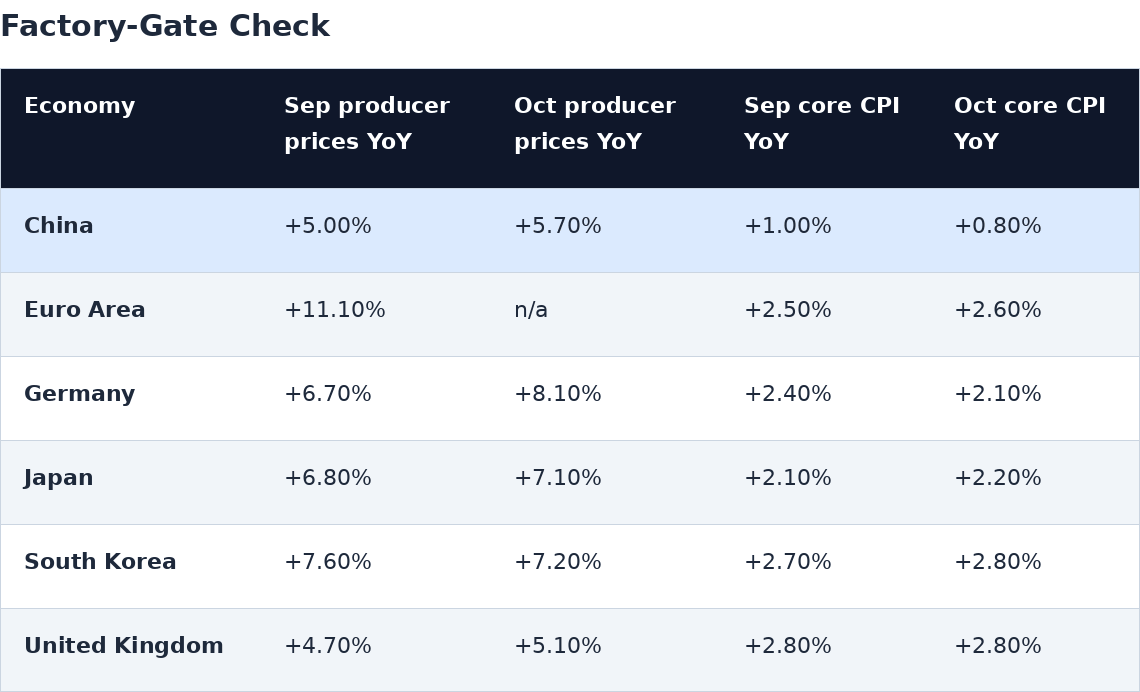
Factory-gate prices had not followed November commodity prices down in the latest comparable releases. China's producer-price inflation accelerated from 5.00 percent in September to 5.70 percent in October even as its core CPI slowed to 0.80 percent. German producer-price inflation rose from 6.70 percent to 8.10 percent. Those October figures do not falsify a November turning point, but they do rule out describing it as an already broad producer-price deflation in these economies.
Consumer prices by country
CPI is the national headline index, using the HICP for the euro area. Index bases vary, and index levels must not be compared across countries. The annual rate compares prices with the same month a year earlier. The change column is October's annual rate minus September's, in percentage points, not annualized monthly inflation. The reported monthly rate may have a different seasonal adjustment from the index, as the OECD's CPI guide explains.
Money, the monetary base and bank lending
Each cell shows September and then October year-over-year growth. "n/a" means no comparable observation was verified in the data used, not zero and not necessarily unpublished by the national authority. No prior-month value is carried forward. National euro-area M2 readings are country contributions or series, not independent currencies, and the shared base is counted once. Money and credit are nominal unless labeled real. Growth from stocks compares like months, and changes in the stocks can also reflect valuation, write-offs, coverage or reclassification.
Important coverage and definition checks
India and Australia. M3 is shown explicitly rather than mislabeled M2. India's M2 series stops in August, when it grew 15.43 percent year over year. India's September reserve money grew 8.34 percent; the October level appears on a different scale, so no change is reported or imputed. India's fortnightly series use the last available observation in each month. Definitions follow the Reserve Bank of India for M0 and the Reserve Bank of Australia's glossary.
South Korea. September M2 rose 0.72 percent from August. The available year-over-year calculation crosses a break in the level series, so we exclude it rather than infer a credit contraction. The Bank of Korea distinguishes its old and revised M2 definitions.
Germany and the United Kingdom. German September M2 rose 0.36 percent month over month, but the retrieved series lacks a September year-earlier denominator. The UK also reported M4 growth of 4.03 percent year over year. Its September net lending to individuals was £5.78 billion, which is a net flow, not annual growth in the loan stock.
Late or narrower loan series. The available broad and private-loan series stop in June for the UK and Germany and in August for Italy, Switzerland, Russia and Canada. Belgium and Russia have September consumer-credit proxies, explicitly labeled; they are not total bank lending. Argentina lacks a verified private bank-loan growth observation in this panel. Canada's available money series also stops in August, as does Russia's M2.
Base money. Base money is currency plus central-bank reserve balances, not simply currency in circulation. Where a national M0 series could not be matched to a full reserve-money definition, we do not count it as a base. This affects, among others, China, Taiwan, South Korea, Russia and the UK, following the People's Bank of China on reserve money and the ECB on base money.
Reading the base series. Japan uses the BOJ's published year-over-year rate rather than imposing a calculation on the separate level series. The euro area uses its September snapshot and the same series' year-earlier level. National definitions are documented by the South African Reserve Bank, Argentina's central bank, Banco de México, Banco Central do Brasil, Poland's NBP, the Swiss National Bank and Statistics Norway.
What would change the diagnosis?
October headline CPI fell month over month in 2 of 34 economies with an October reading. A negative month can reflect seasonality or a single component. Annual CPI is slower to turn, and it cannot capture a November commodity move that had not yet occurred.
Evidence for a spreading demand shock. Consecutive declines in industrial and food inputs, then weaker producer and import prices in local currency, then falling core goods and services prices across more economies. A simultaneous decline in household and corporate loan stocks, not just in their growth rates, would strengthen the case.
Evidence against it. Commodity prices stabilize while private lending and broad money remain positive and core services prices continue to rise. Lower commodity costs in that setting look more like relief for buyers than economy-wide debt deflation.
Currency and supply checks. Compare the same input in the importer's currency and check inventories, harvests, output and freight before attributing a move to demand. In local currency, the price ratio is the dollar commodity-price ratio multiplied by the local-currency-per-dollar exchange-rate ratio, as ECB research on external shocks along the pricing chain sets out.
Assessment. The period shows an international commodity-price decline and specific signs of monetary or household-credit weakness. It does not establish a synchronized contraction in money, lending and consumer prices outside the United States. The next decisive evidence is whether the November commodity declines feed through into local producer prices, household borrowing and core CPI.
Data notes
Scope is the named non-European economies, a broad major-European panel, plus Canada, Indonesia and Saudi Arabia for non-US G20 coverage. The euro area is shown as a cross-check but excluded from all country tallies. All statistics use the latest observations identifiable in the retrieved sources by the cutoff; a real-time first-release vintage was not independently reconstructed. Commodity returns use the actual September 1 close, not August month-end. No full November CPI value is assumed. In the companion data file, source agency, authority, series link, local units, precise observation date and calculated monthly and annual changes are provided where available.
Annual percentage changes in the purchasing-power check are deflated using the same country's September headline CPI: 100 times the ratio of one plus nominal growth to one plus CPI growth, minus one. Country counts are unweighted. Consumer-credit-only proxies are not used here, and money and credit groups can differ because they have different coverage.
Country data are drawn from national statistical agencies and central banks via Trading Economics, market data from FRED, Yahoo Finance and exchange benchmarks, and policy material from the Federal Reserve, Treasury, the BIS, the BLS and the BEA, believed reliable but not independently verified.
This note is market research and opinion, not investment advice or a recommendation to buy or sell any security. The Federal Reserve forecast, the real-rate argument and the market implications are the authors' judgment and may prove wrong.
The authors hold positions in securities mentioned and reserve the right to buy or sell shares at any time without notice.