The 75% Scenario: An Equity-Funded, Stablecoin-Anchored American Productivity Boom


There is a version of the next few years in which the United States is standing at the front edge of a 1920s-style productivity boom — one built on AI and data-center infrastructure, and financed increasingly through equity and tokenized dollars rather than fragile debt. This paper makes the case for that version. We assign it a 75% probability. The other 25% is real, and worth taking seriously, but it is not the depression scenario most people assume it is.
The case starts, as these things usually do, in the plumbing of the money supply.
A Boom Hiding in the Money Supply
The defining monetary feature of mid-2026 is a quiet divergence between broad money and the monetary base. M2 is accelerating even as the base that underpins it keeps shrinking.
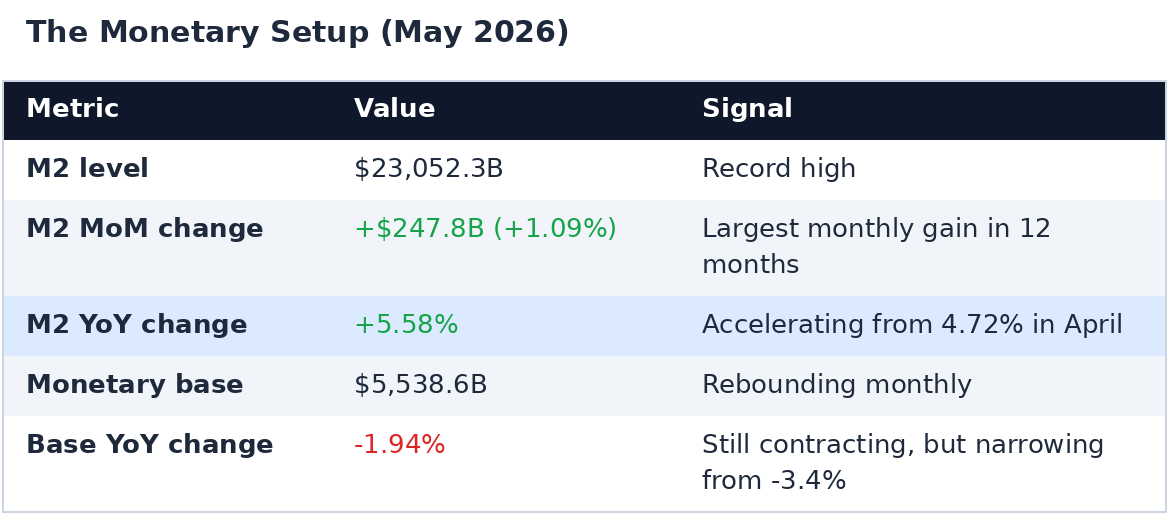
Broad money is expanding through commercial bank credit and deposit creation — not through Federal Reserve reserve injection. This is the endogenous-money mechanism at work: loans create deposits. And it's happening on top of a base that is still contracting, just less sharply than before.
That combination — accelerating M2, shrinking base — is not new. It has a name in monetary history, and it rhymes with a decade most people associate with crashes rather than booms.
Echoes of the 1920s
The 1921–1927 period offers a near-exact structural analog to today.
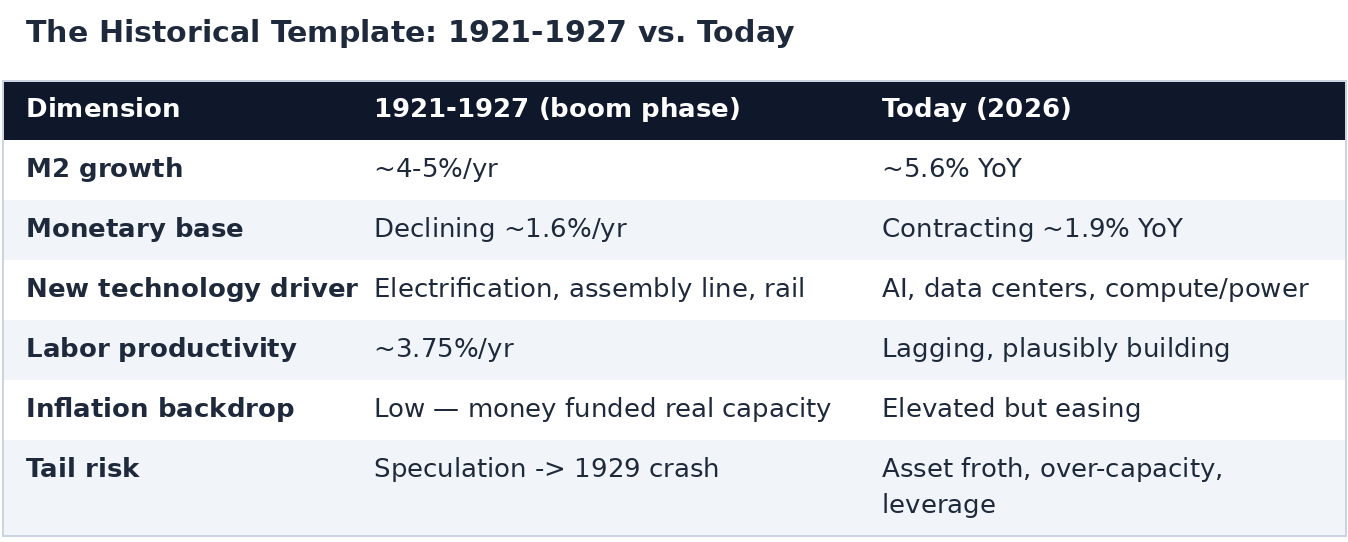
In the 1920s, credit-driven deposit growth atop a shrinking, gold-anchored base funded a genuine technological revolution — electrification, the assembly line, rail expansion. Productivity rose roughly 3.75% a year and real GNP grew about 4.2% a year, with low inflation, because the new money was funding real capacity rather than bidding up prices. That's the "good" version of a credit-led boom, and it's the template this paper leans on.
Why the Productivity Lag Exists — and Why It Hasn't Resolved Yet
The central claim of this paper is simple: when bank lending accelerates and M2 grows quickly even as the base contracts, productivity gains follow — but only after a delay.
The mechanism is straightforward. Credit funds capital investment first: equipment, software, data centers, training. Measured productivity — output per hour — only rises once that investment is actually deployed and workers adapt to it. Historically, that transmission delay runs one to three years.
The pattern shows up again and again across very different eras:
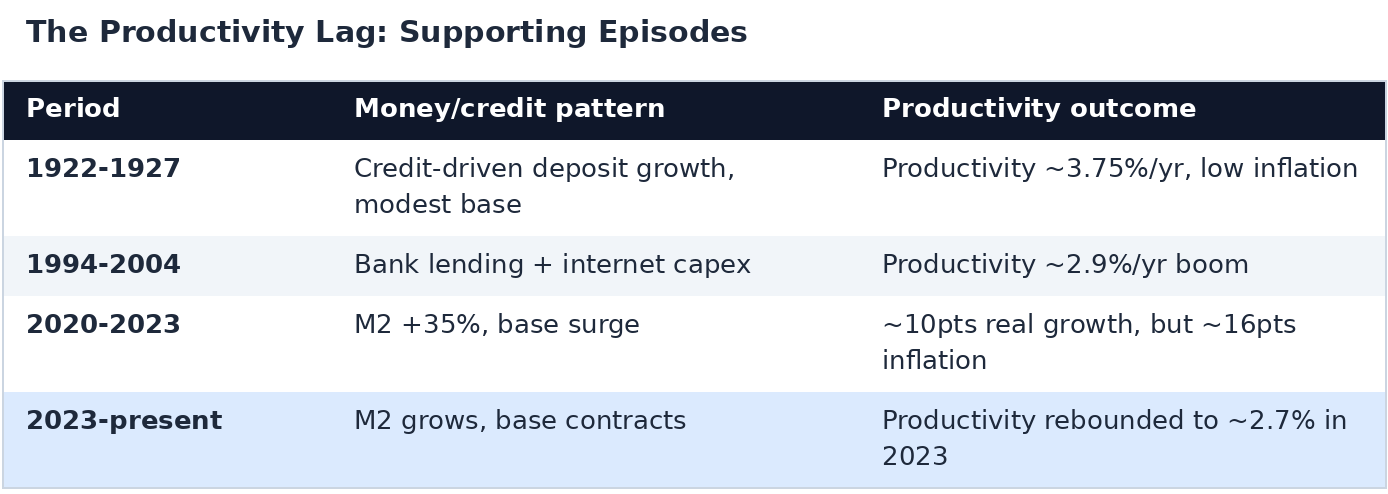
The most recent data points support the "lag, not absence" reading. Real GDP grew 1.6% annualized in the first quarter of 2026; nominal GDP grew 5.15%. M2 velocity sat at 1.409, essentially flat versus 1.410 in the fourth quarter of 2025. Flat velocity is normally read as bearish for this thesis — but here it's interpreted as the lag simply not having resolved yet. It's the calm before the productivity payoff, not evidence the payoff isn't coming.
Financing the Buildout: From Debt, to Equity, to Tokenized Dollars
If the productivity case explains why this could be a boom, the financing structure explains why it might not collapse under its own weight — and this is where the paper's real distinguishing argument lives.
The capex problem is real. AI infrastructure spending relative to cash flow has moved from comfortably self-funded to nearly fully absorbed in just a few years, with debt increasingly bridging the gap.
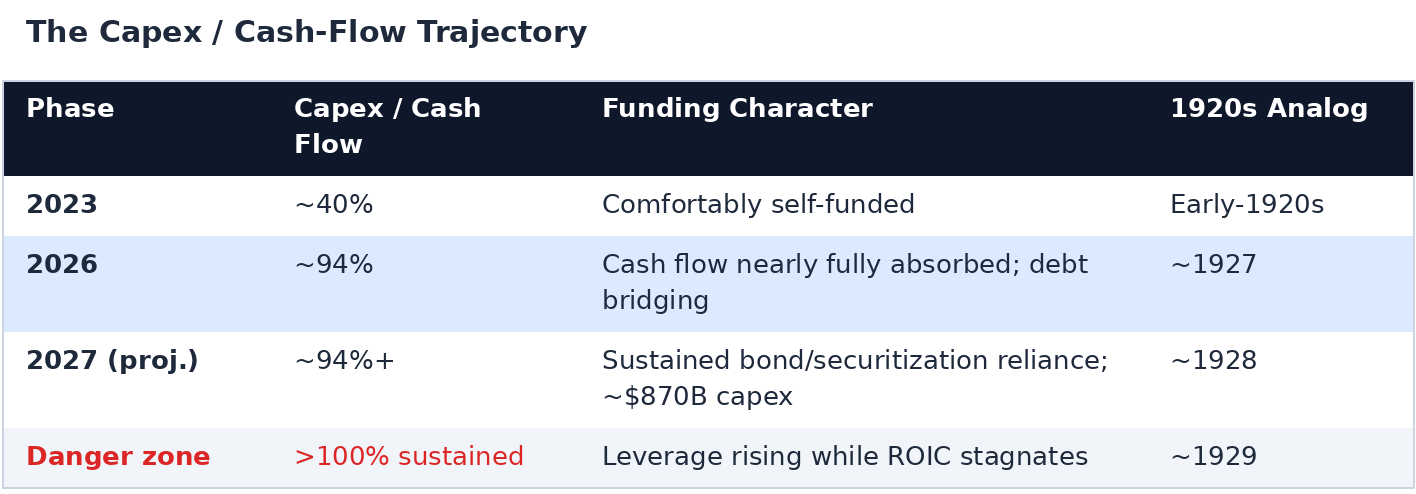
The genuinely dangerous signal here isn't debt itself — it's debt rising while free-cash-flow coverage falls and returns on invested capital stagnate. That's the 1928–1929 pattern, and it's the one to watch for.
The equity escape valve is what makes this cycle different. To the extent AI capex gets funded by equity issuance and stock-for-stock mergers rather than debt, the buildout becomes far more durable. Firms are already doing this — Alphabet's roughly $85 billion equity-and-bond raise is one example. Equity carries no fixed repayment and no refinancing risk, and a rising market lets firms fund real assets with appreciated paper. It's the same mechanism that powered both the 1920s and the 1990s: high valuations enabling productive investment rather than just inflating on top of it. The tradeoff is that the vulnerability migrates from credit risk to valuation risk — durable as long as markets stay elevated, fragile if they don't.
The stablecoin channel is the American-specific edge. Under the GENIUS Act framework, USD stablecoins must be backed 1:1 by U.S. Treasuries, so every new digital dollar created is also a new buyer of U.S. government debt. As stablecoin adoption spreads globally, it creates a persistent, semi-automatic source of demand for U.S. debt — one that pushes back against de-dollarization. There's a denominator effect compounding this too: AI-driven GDP growth shrinks debt relative to GDP, while the stablecoin channel makes the issuance side easier to finance.
It's worth being honest about the scale here: even $2 trillion in stablecoins by 2030 is only about 2% of projected U.S. debt. This is not debt "erasure" — it's a meaningful edge at the margin, not a silver bullet.
Put together, the asymmetry is structural. The U.S. has deep equity markets and a tokenized-dollar pipeline. Debt-constrained nations — lacking comparable equity depth and global token demand — face tighter caps on how much they can lever into the AI buildout. That gap is the mechanical source of American outperformance in this thesis, not a vague appeal to American exceptionalism.
The Base Case: America Pulls Ahead
We assign this scenario a 75% probability.
In this world, capex stays at or below roughly 90–100% of cash flow, with equity issuance remaining robust and opportunistic. Debt grows more slowly than AI revenue and cash flow, and interest coverage holds. Labor productivity drifts from today's 1.5–2% range toward the 3–4% territory of the 1920s. Real GDP re-accelerates from 1–2% toward 3%-plus, with inflation contained. M2 velocity begins a sustained climb off its current ~1.4 floor. Valuations stay elevated but don't blow off, because earnings grow into the multiples rather than the multiples running away from earnings. And stablecoin Treasury holdings rise steadily, quietly absorbing marginal debt issuance along the way.
The outcome, if this path holds: the U.S. runs a 1927-style productive boom longer, and with less fragility, than a purely debt-financed version would allow — pulling structurally ahead of the rest of the world in the process.
The Tail Risk: A China Shock, Not a Depression
The remaining 25% is split across adverse scenarios, but one dominates: a China-triggered market rout that looks like the late-1928 into 1929 turn.
How it starts. A shock originates in China — a credit event, a sharp growth disappointment, a geopolitical escalation, or a disorderly deleveraging — and propagates into global risk assets at a moment of extreme valuation. CAPE ratios near 40x have only been seen twice before, in 1929 and 1999. The leveraged, late-cycle characteristics of the global AI-financing complex amplify the shock: private credit and ABS/CMBS issuance has been rising, and bank exposure to non-bank financial institutions has climbed from roughly 1% in 2013 to about 14% today.
Why it doesn't become 1929–1933. This is the part of the thesis that separates a sharp dislocation from a true catastrophe. Four structural differences matter:
- U.S. AI capex is more equity-funded and cash-flow-backed than that of debt-dependent foreign competitors, so balance-sheet damage stays contained.
- The stablecoin-Treasury channel provides a structural bid for U.S. debt even amid global risk-off conditions, preserving American financing flexibility while debt-constrained nations face a funding squeeze.
- Policy memory matters: unlike 1929–1933, when the Fed allowed M2 to contract by 27%, modern policy follows the Great Recession precedent of quadrupling the base to keep M2 growing rather than letting broad money collapse.
- The real AI infrastructure built during the boom doesn't disappear in a market rout — it keeps compounding output once sentiment stabilizes.
The outcome in this tail: a sharp but recoverable dislocation, after which American structural advantages — equity depth, tokenized-dollar demand, and an already-deployed productivity base — reassert themselves and widen the gap versus the rest of the world, especially China.
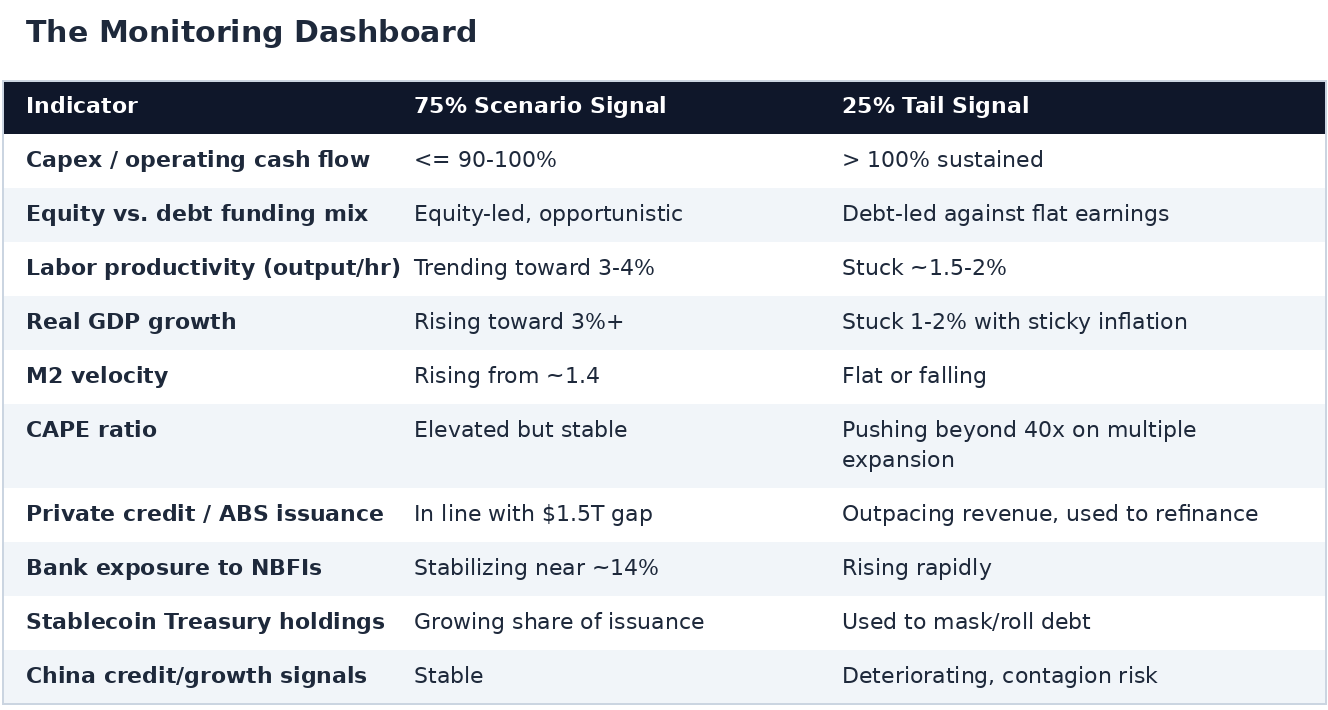
What to Watch
The two paths diverge on a specific, trackable set of indicators. This is the dashboard worth revisiting every quarter:
The Bottom Line
The monetary configuration of mid-2026 — accelerating M2 atop a contracting base — is structurally identical to the 1921–1927 productivity boom. What distinguishes today from a repeat of 1929 is where the credit flows. Right now, it flows overwhelmingly into productive AI and power infrastructure, increasingly funded by equity and by a uniquely American tokenized-dollar demand channel.
We assign 75% probability to a self-sustaining, productivity-led boom in which the United States pulls decisively ahead. We assign 25% to adverse tails, the dominant one being a China-triggered, late-1928-into-1929-style market rout — from which, we argue, the U.S. recovers and continues to pull away, owing to its equity-funded capital structure, its stablecoin-anchored debt demand, and the irreversible productivity base built during the boom.
The risk, in short, is no longer "can America repay its debt?" It is "can the valuations and the AI revenue materialize?" — and on present evidence, the odds favor that they will.
This whitepaper synthesizes monetary, historical, and capital-markets analysis. Figures for M2 and the monetary base are sourced from the Federal Reserve H.6 release (June 23, 2026). Historical 1920s data, AI capex/financing estimates, and valuation metrics are drawn from cited research. Probability weightings reflect the author's thesis and are not statistical forecasts.