The 2026 Inflection: Why Today's Monetary Conditions Replicate 1927 And Why the Crisis Will Migrate Abroad


The U.S. monetary system in early 2026 has reached a configuration unseen since the late 1920s: a steadily expanding broad money supply coexisting with a contracting monetary base, a sharply rising money multiplier, surging productivity, and disinflationary consumer prices. This combination, historically rare and historically consequential, is the precise signature of the 1927 economic environment that preceded the most extraordinary asset-appreciation cycle in modern history.
This whitepaper synthesizes our prior research into a unified strategic framework. We argue that 2026 is the structural analog of 1927, but with one transformative difference: the financial fragility that turned the late-1920s boom into the 1929–1933 collapse has been structurally engineered out of the U.S. system by tokenization, the GENIUS Act, and AI-driven productivity gains. Instead, that fragility has been exported to the rest of the world through stablecoin-driven disintermediation of $45 trillion in foreign bank deposits trapped in low-rate, high-debt economies.
The investment conclusion is unambiguous: a multi-year period of U.S. and Middle East asset appreciation, productivity-driven disinflation, dollar strength, and accelerating banking stress in Japan, Europe, China, and over-leveraged emerging markets. The risk is not U.S. inflation. The risk is the timing of foreign banking crises that this disintermediation will trigger — and whether they spill back into U.S. markets via funding stress before the productivity dividend matures.
Part I: The M2 Anomaly
The Headline Data
The April 28, 2026 Federal Reserve H.6 release confirmed that U.S. M2 money supply reached a new all-time high of $22,686.0 billion in March 2026, representing 5.59% cumulative growth over the prior 15 months. On the surface, this is unremarkable — broad money expanding modestly in nominal terms.
But the surface conceals a profound dislocation in the composition of money creation.
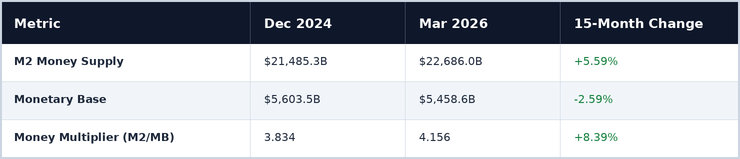
While M2 expanded +5.59% over 15 months, the monetary base contracted by -2.59%, declining from $5,603.5B to $5,458.6B as reserve balances at the Federal Reserve fell from approximately $3.4 trillion to $3,016.1B, reflecting the cumulative impact of quantitative tightening prior to the Fed's pivot announcement in early 2026.
The Money Multiplier Surge
The mathematical residual of these two trends is a money multiplier expansion of +8.39% — the largest sustained multiplier increase since the pre-2008 era. This indicates that the entire growth of broad money is being driven by bank lending velocity, not Federal Reserve balance sheet expansion. Banks are deploying reserves into deposit-creating loans at a pace not seen in fifteen years.
The Bullish Signal Framework
Our back-test of FRED M2 data and S&P 500 monthly prices since 1959 (805 valid observations) identified 148 months in which M2 month-over-month growth exceeded 0.8% and year-over-year growth exceeded 5.0% simultaneously. In those signal months, the S&P 500 was up 65.5% of the time the following month versus a 61.7% baseline, and average one-month forward returns ran at +1.05% versus +0.66% baseline, 1.6× the base rate.
March 2026 narrowly missed the threshold. The signal has not yet triggered, but the underlying conditions — multiplier expansion, productivity surge, and credit channel reactivation are intensifying.
Part II: The 1927 = 2026 Parallel
The Identification
The data raises a question that traditional monetary frameworks struggle to answer: how can the money multiplier expand +8.39% while the monetary base contracts -2.59%, and CPI inflation remain contained?
The answer requires a historical analog that economic textbooks rarely invoke. That analog is 1927.
The late-1920s configuration featured every defining element of today's setup: a productivity surge driven by transformative general-purpose technology, rapid broad money expansion coexisting with disinflationary CPI, a rising money multiplier driven by bank credit deployment, strong dollar conditions, capital inflows, and asset price appreciation dramatically outpacing nominal GDP.
Productivity: The 1920s Comparison
From 1919 to 1937, U.S. output per labor-hour grew at 3.5% annually, or nearly triple the 1.2% rate of the prior two decades. The drivers then map directly onto today's accelerants.
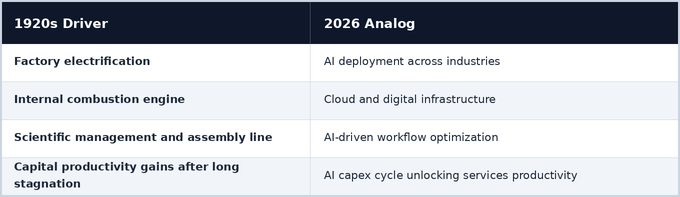
Today's productivity surge of +4.9% in late 2025 is, on annualized terms, larger than the 1920s electrification dividend. And critically, the AI productivity wave is just beginning to penetrate the services sector, which is 70% of U.S. GDP and has resisted productivity gains for decades.
The 1927–1929 CPI Pattern
Despite vigorous money supply expansion in the late 1920s, the CPI declined. The Bureau of Labor Statistics confirms prices fell an average of 1.1% annually from 1926 to 1929 despite robust monetary expansion.
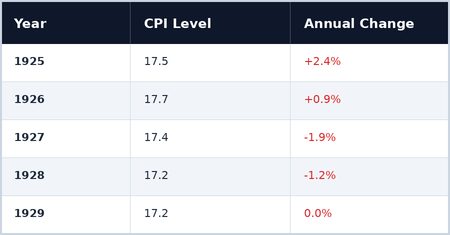
This is the closest historical precedent for the configuration we expect to see in U.S. CPI prints through 2027–2028. The mechanism is precise: when productivity expands the supply of consumer goods, monetary expansion does not raise their prices. But fixed-supply assets such as land, equities, scarce real estate cannot be productivity-multiplied. Monetary expansion captured by these assets becomes pure asset inflation. The Dow Jones Industrial Average rose +300% from 1924 to its 1929 peak, while consumer prices fell.
The Mexican Revolution Resolution Parallel
The Mexican Revolution effectively ended in 1920 and was fully stabilized by the 1923 Bucareli Treaty. The resolution removed the major geopolitical risk premium from U.S. assets, repatriated capital that had fled to safety, stabilized U.S. oil supply, enabled the Federal Reserve to maintain accommodative policy, and coincided precisely with the start of the 1926–1929 CPI deflation period.
The parallel to today is exact. The Iran conflict's resolution, which Chatham House has characterized as one in which "dollar dominance is surviving the Iran war," produces the same effects: removal of the Strait of Hormuz risk premium pushing oil toward $50–60, trade re-routing efficiency restored, capital repatriation flows toward USD assets, defense spending normalization, and industrial commodity reset lower.
Part III: The Tokenization Inflection and Why This Cycle Differs From 1929
The 1929 Failure Modes
The 1920s asset boom turned into the Great Depression because three financial-system failure modes activated in sequence: margin call cascades triggered forced asset liquidation, bank balance sheet contagion spread from collapsing collateral chains, and the money multiplier collapsed — M2 fell 33% from 1929 to 1933 as bank credit contracted.
Each of these failures was a function of the technology of 1929 finance: unsecured broker call loans, opaque collateral chains, no real-time mark-to-market, and manual reconciliation taking days.
Tokenization as Structural Replacement
Tokenization fundamentally rebuilds this entire architecture. Atomic settlement compresses T+2 to near-instant. Programmable collateral auto-rebalances and executes margin calls cleanly. Real-time transparency eliminates the counterparty opacity that drove 1930s contagion. Cross-border settlement runs at 96% lower cost than legacy rails. There were 18+ digital bond issuances in public markets during 2025 alone — this is production-grade infrastructure, not a pilot.
S&P Global's February 2026 analysis is unequivocal: tokenization is "now changing capital markets," with infrastructure moving from pilot to production at unprecedented speed. The Davos 2026 financial infrastructure consensus characterized it as "no longer experimental, but rather the new financial infrastructure."
The GENIUS Act: The Regulatory Capstone
The GENIUS Act of 2025 codified the U.S. dollar stablecoin into federal law with 1:1 reserve backing in cash or short-dated Treasuries, monthly disclosure requirements, legal protections for stablecoin holders in issuer insolvency, and the first U.S. legislation establishing dollar-backed stablecoins as global digital reserve assets.
In December 2025, the OCC conditionally approved national trust bank charters for Circle (USDC), Paxos, and three additional non-bank firms. The OCC issued its formal implementation proposal in March 2026. The plumbing is built. The regulation is in place. The infrastructure is operational.
The AI + Healthcare Productivity Wave
The next phase of the productivity surge will hit healthcare and services within one to three years. BCG's 2026 healthcare outlook confirms organizations are embracing AI across patient care, clinical workflows, drug discovery, and development at unprecedented scale, with drug discovery pipelines compressing from 10–12 years to 5–7 years. This is the services-sector equivalent of 1920s factory electrification, applied to the 70% of GDP that has resisted productivity gains for decades.
Net Effect: The 1920s Pattern, Without the 1930s Endgame
The combined effect of tokenization, the GENIUS Act, and AI-driven productivity is to deliver the favorable elements of the late 1920s, productivity dividend, asset appreciation, monetary expansion, dollar strength without the financial fragility that turned 1929 into 1933. Margin call cascades cannot occur on atomic-settlement rails. Bank contagion cannot propagate through tokenized, transparent collateral chains. Multiplier collapse cannot trigger a 33% M2 contraction when programmable credit can be rebalanced rather than liquidated.
This is the central thesis: 2026 is the structural analog of 1927, but with the crisis vulnerabilities engineered out of the U.S. system.
Part IV: The Disintermediation Thesis and Where the Crisis Goes Instead
The $45 Trillion Trapped Capital Pool
Financial fragility, like energy in physics, is not destroyed — it is relocated. Today, that "somewhere" is $45 trillion in global bank deposits trapped in low-rate, high-debt economies: Japan (~$8–10T at near-zero rates with debt/GDP at 260%), the Eurozone (~$15T with negative real rates and structural periphery weakness), China (~$20T+ in CNY deposits behind capital controls with collapsing real estate collateral), and the UK, Korea, Switzerland, and smaller advanced economies (~$5–7T additional).
For the first time in history, retail and institutional depositors in these jurisdictions have access to legally compliant, regulated, dollar-denominated digital alternatives.
The Federal Reserve Has Confirmed the Mechanism
In February 2026, the Federal Reserve Bank of New York published "Stablecoin Disintermediation," providing the first transaction-level empirical evidence that stablecoins erode bank deposit franchises and transmit liquidity stress to the banking system. Banks holding stablecoin-related deposits experience substantial increases in payment demand, must operate with much larger reserve balances, and see their loan share of assets contract relative to peers. The Federal Reserve Board itself flagged in December 2025 that deposit reductions could be "most significant" if issuers gain master account access at IORB rates.
The IMF Has Identified the Geographic Risk
On April 2, 2026, the IMF published "Tokenized Finance," identifying emerging market instability as one of four major tokenization risks — warning that rapid adoption without commensurate regulatory infrastructure could introduce capital flow volatility that existing macroprudential tools are not designed to address. S&P Global Ratings framed the same problem for Asian banks as a stablecoin "dilemma: disintermediation or adaptation." The Davos 2026 consensus warned of "the privatization of money and the potential loss of monetary sovereignty, especially in emerging markets dominated by dollar-backed stablecoins."
The 1920s Mechanism Inverted
The 1920s pattern was European capital fleeing to U.S. banks. The 2026–2029 pattern is structurally identical, but with faster, more brutal mechanics.
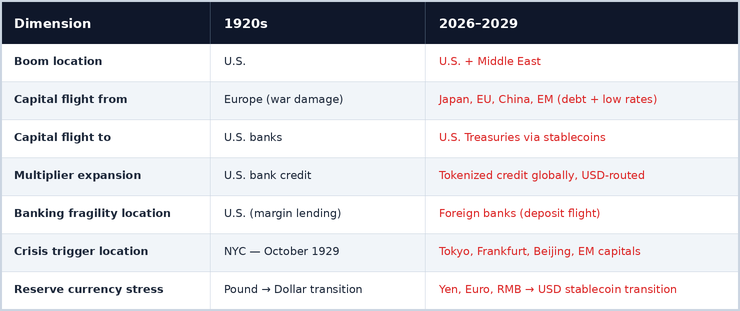
The geographic redistribution is the master insight: the 1929 collapse happened in the U.S. because that was where the leverage and fragility were concentrated. Today, the leverage and fragility are concentrated in non-U.S. banking systems that cannot survive deposit flight to USD stablecoins.
The Foreign Banking Trilemma
Banks in Japan, the Eurozone, China, and many emerging markets face an impossible choice. They can accept losing deposits to USD stablecoins, slow death by balance sheet contraction. They can issue domestic-currency tokenized deposits, but these will be denominated in precisely the currencies depositors are fleeing. Or they can restrict access, but this only delays the inevitable and triggers black-market workarounds. Each option leads to the same destination: bank shrinkage, currency depreciation, sovereign debt stress, and eventual capitulation toward functional dollarization.
The U.S. and Middle East Boom
The mirror image of the foreign banking stress is the U.S. and Middle East asset boom. Stablecoin issuance creates structural Treasury demand at 1:1 reserve ratios. OCC chartering of Circle, Paxos, and others legitimizes the entire stack. Foreign deposits flow into U.S. Treasuries via stablecoins, lowering the risk-free rate. Tokenized RWA markets route global lending through U.S. infrastructure. AI productivity gains accrue disproportionately to U.S. technology leaders.
In the Middle East, USD-pegged GCC currencies align natively with stablecoins with no FX friction. Post-Iran-war reconstruction capital flows through tokenized infrastructure. And Dubai and Abu Dhabi are positioning as global RWA hubs alongside New York, with no legacy banking entrenchment to slow the transition.
Part V: The Synthesized Framework and Investment Conclusion
The Eight-Driver Framework
Assembling each component of this analysis produces a single coherent macroeconomic framework for 2026–2029.
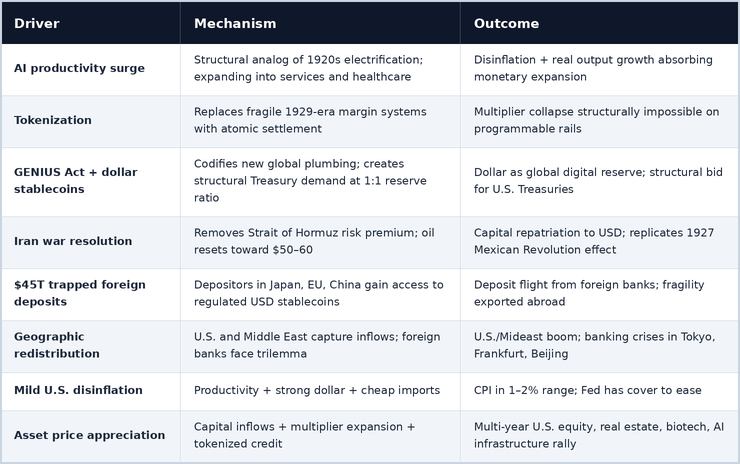
This framework explains observations that traditional macroeconomic models cannot reconcile: why CPI keeps undershooting forecasts despite money supply growth; why the dollar remains strong despite massive fiscal deficits; why U.S. asset prices keep rising despite "expensive" valuations; why Japan, the Eurozone, and China face accelerating problems simultaneously; why the Middle East has suddenly become investable infrastructure; and why the Federal Reserve will likely ease without triggering inflation.
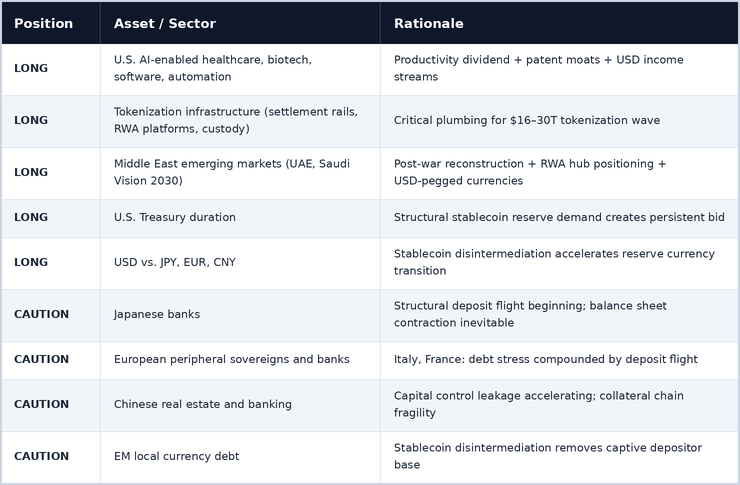
Strategic Positioning
The Final Conclusion
The investment landscape of 2026–2029 will resemble 1927–1929 in every major respect — productivity surge, monetary expansion via multiplier, dollar strength, asset appreciation, mild disinflation, but with the financial fragility relocated from the United States to the rest of the world.
The 1929 collapse cannot repeat in the U.S. because tokenization has replaced the fragile margin lending architecture, the GENIUS Act has codified dollar-backed digital infrastructure, AI productivity gains are absorbing money supply expansion as real output, and stablecoin Treasury demand creates structural support for U.S. fiscal capacity.
But the 1929 collapse will occur, in modified form, in the foreign banking systems that cannot withstand the deposit flight that the GENIUS Act has now legitimized and accelerated. Tokyo, Frankfurt, Beijing, and the capitals of over-leveraged emerging markets will experience the crisis dynamics that the U.S. avoided.
The risk to monitor for U.S. investors is not domestic inflation. It is the timing and severity of the foreign banking crises that this disintermediation will inevitably trigger, and whether they spill back into U.S. markets via funding stress, geopolitical instability, or correlated risk-off events before the productivity dividend matures into broad-based prosperity.
The thesis, in one sentence: 2026 is the structural twin of 1927, but the financial fragility has been engineered out of the United States and exported to the rest of the world, producing a multi-year U.S. and Middle East asset boom alongside accelerating banking and currency stress in Japan, the Eurozone, China, and over-leveraged emerging markets.
Be long U.S. productivity. Be long tokenization infrastructure. Be long Middle East reconstruction. Be long the dollar. Be long Treasuries. And be short the structural losers of the disintermediation cycle.
The views expressed in this whitepaper represent independent macroeconomic analysis. This is not investment advice. Readers should conduct their own due diligence before making investment decisions.