Japanese Government Debt: Rate Shock Meets a Shrinking Deposit Base


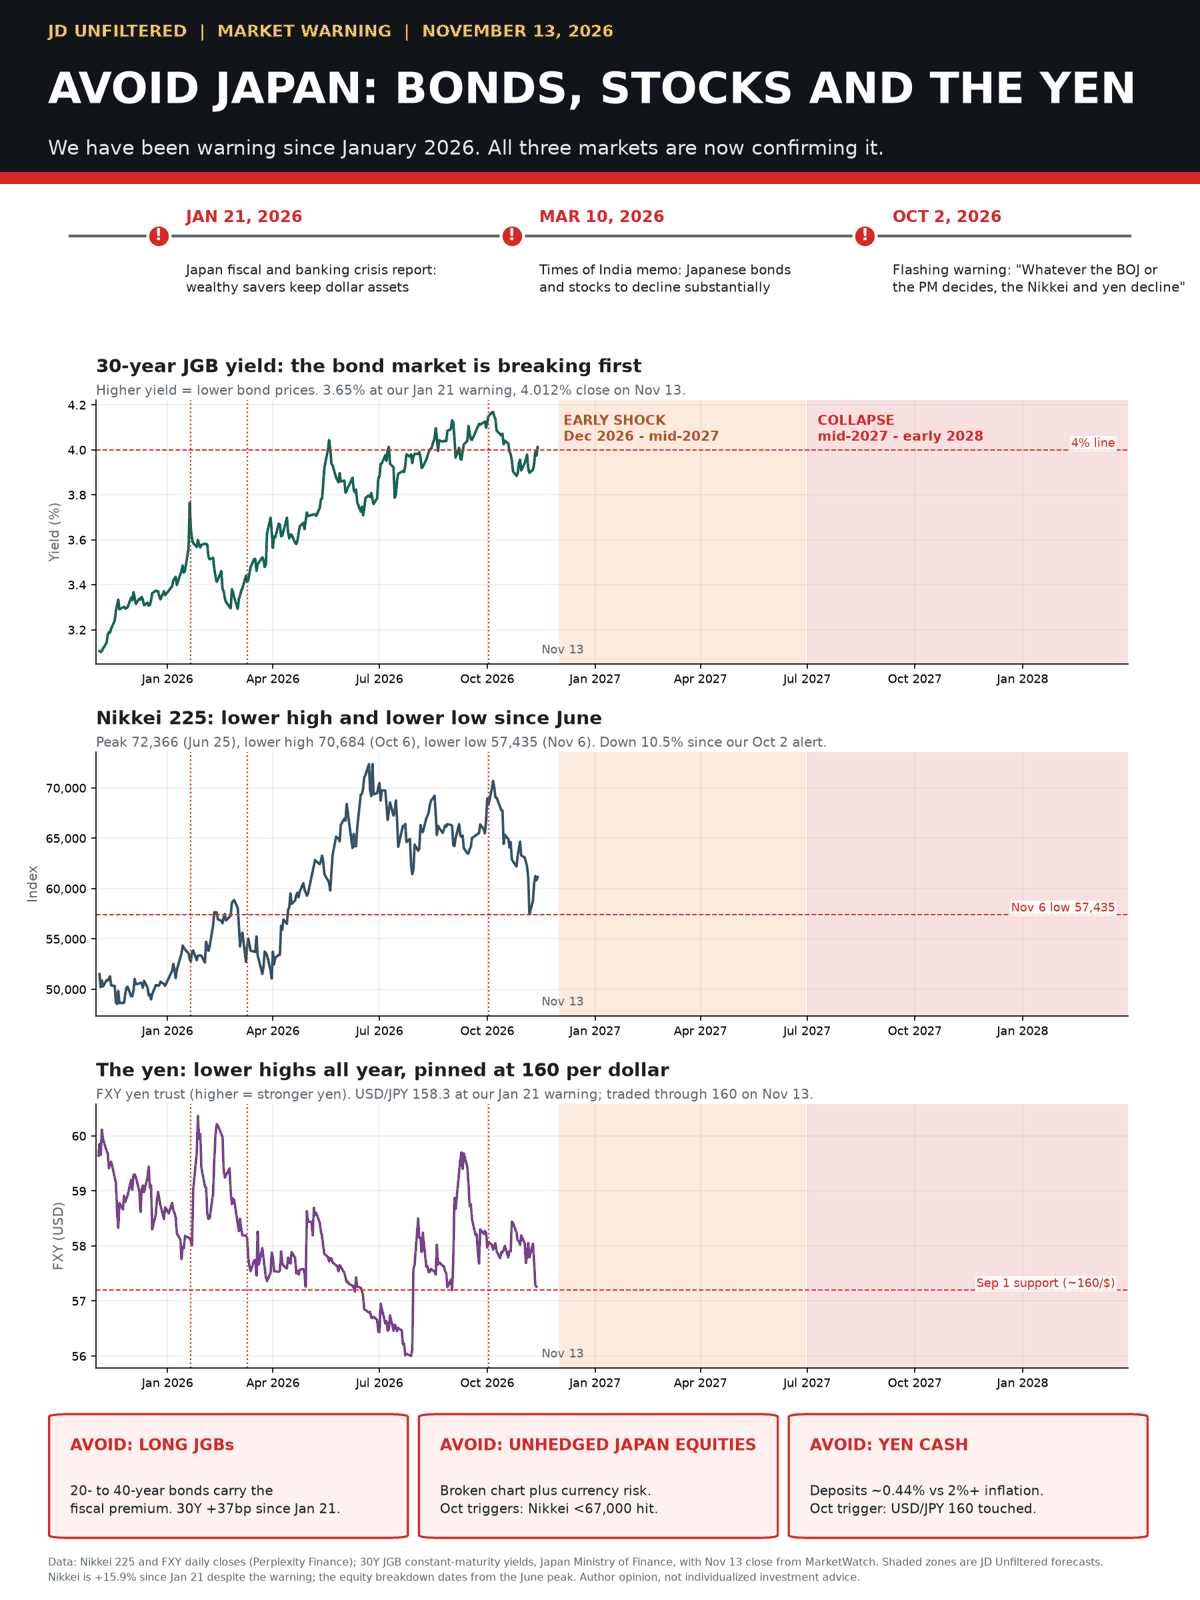
We have been warning since January 2026. The 30-year JGB closed at 4.012 percent on November 13.
Bottom line
Japan is not facing a default. It is facing the end of the arrangement that kept its debt cheap. For thirty years, Japanese household savings sat in bank deposits, banks recycled those deposits into JGBs and BOJ reserves, and the BOJ bought whatever was left. All three parts of that arrangement are now weakening at the same time.
One. Price. The 10-year broke 3 percent for the first time since 1996, and the 30-year set a record above 4.2 percent.
Two. The central bank buyer. The BOJ is cutting its purchases and raising rates, and it has said underlying inflation has reached its 2 percent target.
Three. The funding base. Deposit growth has slowed to about 1.4 percent while bank lending grows 5.2 percent. Demand deposits are already shrinking year over year.
The main risk is not default. It is the government losing control of its markets. Interest costs take a larger share of the budget each year, long-term yields need a higher premium to attract buyers, and the yen is the main pressure valve. This report's view is that stocks, bonds and the yen are all nearing a breaking point. It expects an early shock soon, followed by a broader collapse from mid-2027 to early 2028.
Savers are clearly moving money in search of better returns. Time deposits are growing while demand deposits shrink, and retail JGB purchases have doubled. The largest share of the money leaving deposits, though, is going abroad: households are buying foreign equities, mostly US stocks, at about ¥16tn a year. Gold is not a major destination. Japanese retail investors have been net sellers of gold bars and coins for two quarters, and gold tokens are still a rounding error. On the fiscal side, tax revenue is running about 12 percent above last year, which for now covers rising interest costs. The reason is that inflation is outpacing deposit rates, so savers are effectively paying part of the cost.
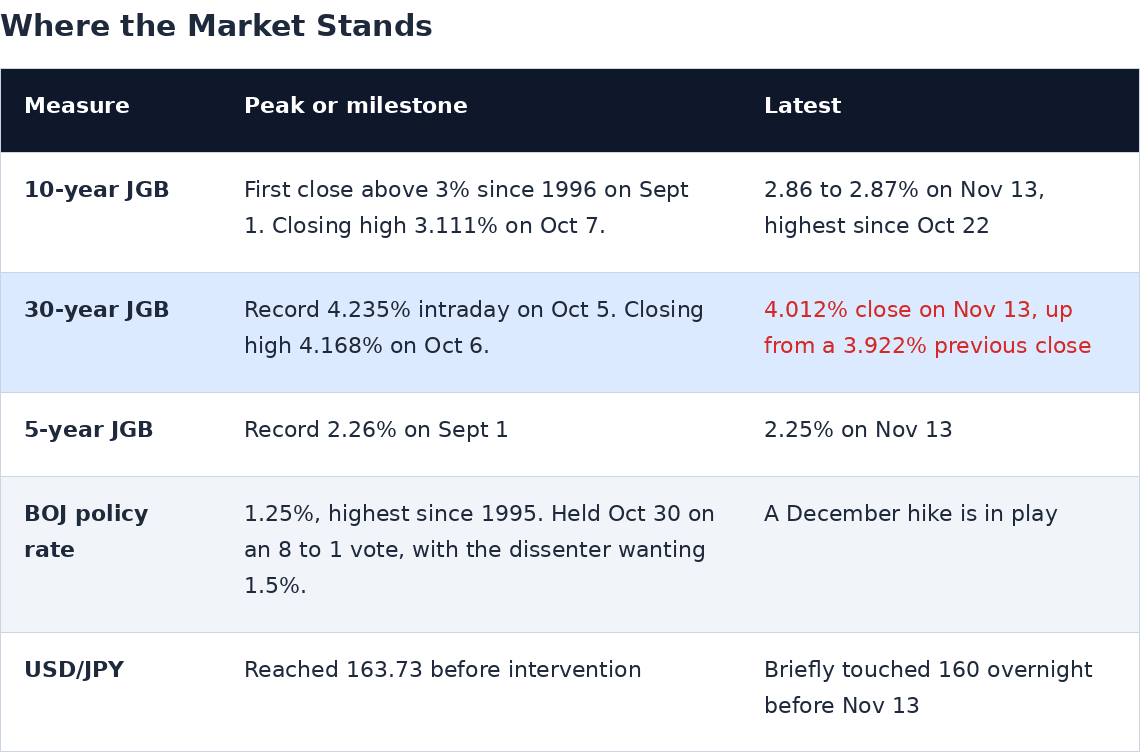
The 30-year closed at 4.012 percent on November 13, back above 4 percent for the second time in about five weeks. The 10-year rose to about 2.86 to 2.87 percent. It is back near its late-October levels but has not yet retaken 3 percent. The move came straight after a weak 30-year auction, and it reversed the safe-haven rally that followed the AI-equity selloff. In other words, the October pullback was driven by flows into safety, not by any change in the fundamentals behind higher long-term yields.
Where the market stands
The November 10 30-year auction is a warning sign. Reuters described demand as weak. Based on Ministry of Finance results, bids of ¥1,512.6bn against ¥450.7bn accepted give a bid-to-cover ratio of about 3.36 times. The tail, meaning the gap between the lowest accepted yield of 3.871 percent and the average yield of 3.847 percent, was 2.4 basis points. The October 30-year auction drew about 3.88 times. That is not a buyers' strike, but buyers are clearly asking for more yield to take long-dated supply.
What the return above 4 percent signals
Auction buyers are already losing money. With the 30-year at 4.012 percent, bonds bought at the November 10 auction's 3.847 percent average yield are about 16.5 basis points underwater within three days. Weak follow-through after auctions makes dealers and fast-money accounts more cautious at the next super-long sale.
The long end is leading. The 10s30s spread, the 30-year minus the 10-year yield, is now about 114 basis points, 4.012 percent minus about 2.87 percent. At the October peaks it was about 106 basis points, 4.168 percent on October 6 against 3.111 percent on October 7. A wider spread while the 10-year stays below 3 percent means the pressure is coming from term premium and fiscal and supply concerns, not from expectations for BOJ policy rates.
The driver is imported. Friday's selloff tracked US Treasuries as traders priced in more aggressive Fed hikes, Bloomberg reported. Japan can't fully control its long-end yields while US long-term yields keep rising.
The budget is more exposed. The FY2027 debt-service request assumes 3.8 percent. A 30-year above 4 percent and a 10-year heading back toward 3 percent make an upward revision in December more likely.
The debt arithmetic
The stock
General government gross debt is about 200 percent of GDP. The IMF projects 199.4 percent for 2026, and the Ministry of Finance's own series shows 204.4 percent. Net debt is lower, at about 127 percent of GDP on IMF data, because the public sector holds large financial assets, including pension reserves and foreign exchange reserves.
The flow: interest costs are now rising fast
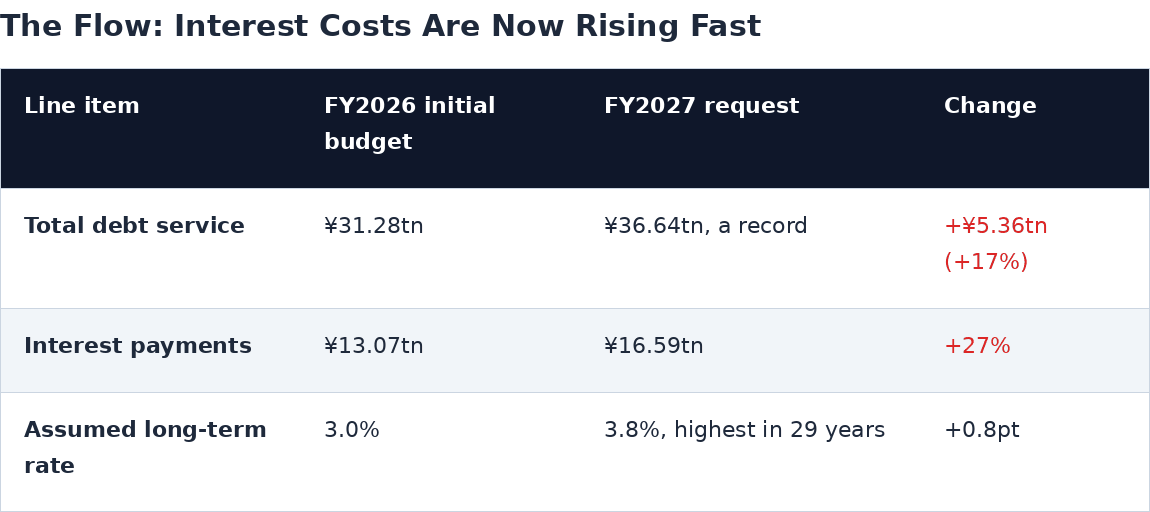
Debt service already takes about a quarter of the general account budget, 24.9 percent in FY2026, on Ministry of Finance figures. Gross interest payments alone are set to exceed 2 percent of GDP, according to East Asia Forum.
The 3.8 percent assumption may not be the final number. In practice the Ministry of Finance sets its assumption at roughly the market 10-year yield plus about 1.1 points. With the 10-year near 3 percent in September and October, some commentators expected a revision into the 4 percent range when the budget is finalized in December. The retreat to about 2.86 percent reduces that pressure but does not remove it. FY2026 is a precedent: its assumption rose from 2.6 percent at the request stage to 3.0 percent in the final budget.
Why the damage is gradual
Japan's main defense is maturity. The average residual maturity of its debt is about 9.5 years, which slows the pass-through of higher rates, the IMF's Article IV report notes. Under the Ministry of Finance's own sensitivity analysis, a 1-point rise in rates adds about ¥0.8tn to debt service in FY2027, ¥2.1tn in FY2028 and ¥3.8tn in FY2029. The cost builds up as each maturing bond is refinanced at the higher rate.
There is a catch the headline maturity figure hides. The BOJ funded its holdings of roughly ¥505tn in JGBs by creating bank reserves that pay the overnight rate. On a consolidated basis, government plus BOJ, a large share of Japan's public debt effectively reprices with the policy rate. Each BOJ hike therefore hits the consolidated public sector almost immediately, through higher interest paid on reserves and lower BOJ remittances to the Treasury. This is the "relabeling, not netting" point VanEck has made. The BOJ's unrealized loss on its JGBs reached a record ¥45.4tn at the March 2026 fiscal year-end, Dow Jones reported.
r versus g: the margin is thinning
The IMF's benign path, with debt falling to about 193 percent of GDP by 2031, depends on nominal growth staying above the effective interest rate. The Ministry of Finance itself now warns that "the assumption that 'r<g lasts' is uncertain." Today the effective rate on the whole debt stock is still well below market yields, because older low-coupon debt dominates. That gap narrows every year, and the rate on new borrowing, about 2.9 percent at 10 years and 3.9 percent at 30 years, is already in the range of plausible nominal growth.
Tax receipts: inflation is paying the bill, for now
The government publishes tax receipts with year-over-year comparisons. The Ministry of Finance releases a monthly Survey of the Amount of Tax and Stamp Revenues, which shows cumulative general-account collections for the fiscal year against the budget, along with monthly Treasury receipts and payments compared with the prior year.
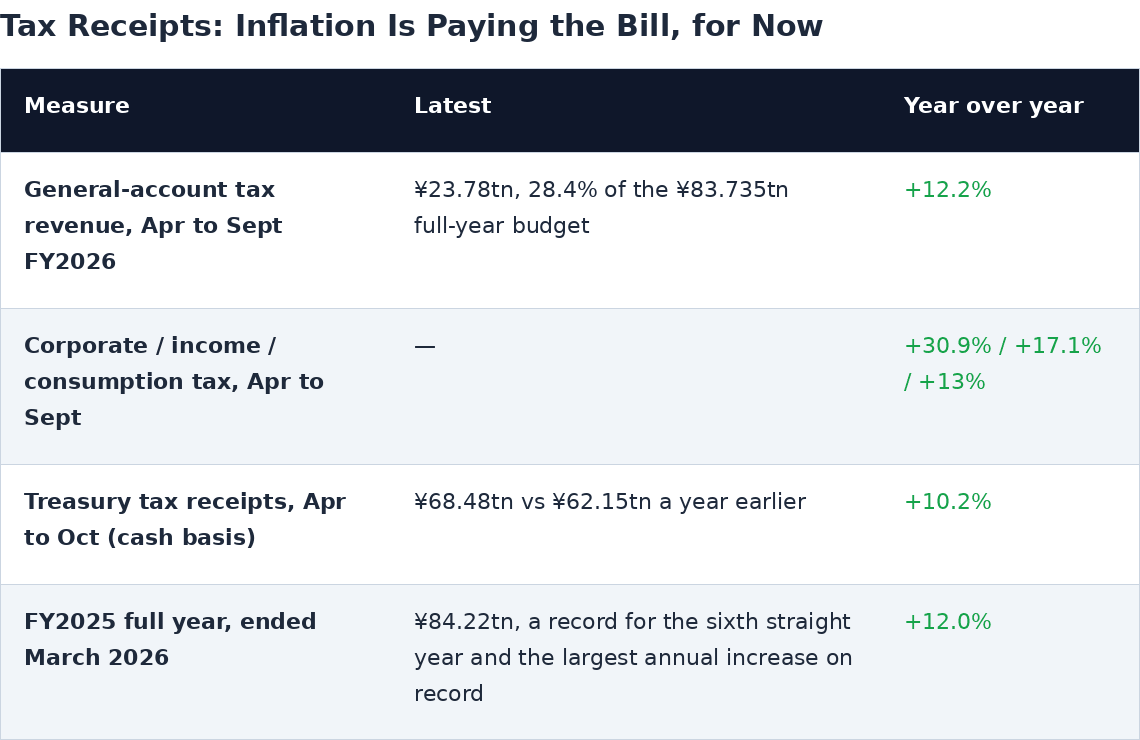
Revenue is beating the budget. The FY2026 budget assumed ¥83.735tn, slightly less than FY2025's actual ¥84.22tn, but the first half is running about 12 percent ahead of last year. Dai-ichi Life Research Institute estimates FY2026 revenue at ¥89.8tn, about ¥6.1tn above the government's forecast.
For now, revenue is outrunning interest costs in yen. FY2025 revenue rose about ¥9tn. The FY2027 request adds about ¥3.5tn of interest. Strong revenue is a big reason the IMF still sees nominal growth above the effective interest rate.
The windfall comes from inflation and corporate profits. Inflation raises receipts immediately. Higher interest rates reach the budget only gradually, as old bonds are refinanced, so the benefit shows up first and the cost later. That timing advantage shrinks each year as more debt reprices.
Depositors are paying part of the cost. The average deposit rate is about 0.44 percent, and September CPI was 2.1 percent. That leaves depositors with a real, after-inflation return of roughly minus 1.7 percent. When savers earn less than inflation, the real value of the government's debt erodes, which helps the government at savers' expense. This is the main reason savers are now moving money in search of better returns.
Who buys the bonds now
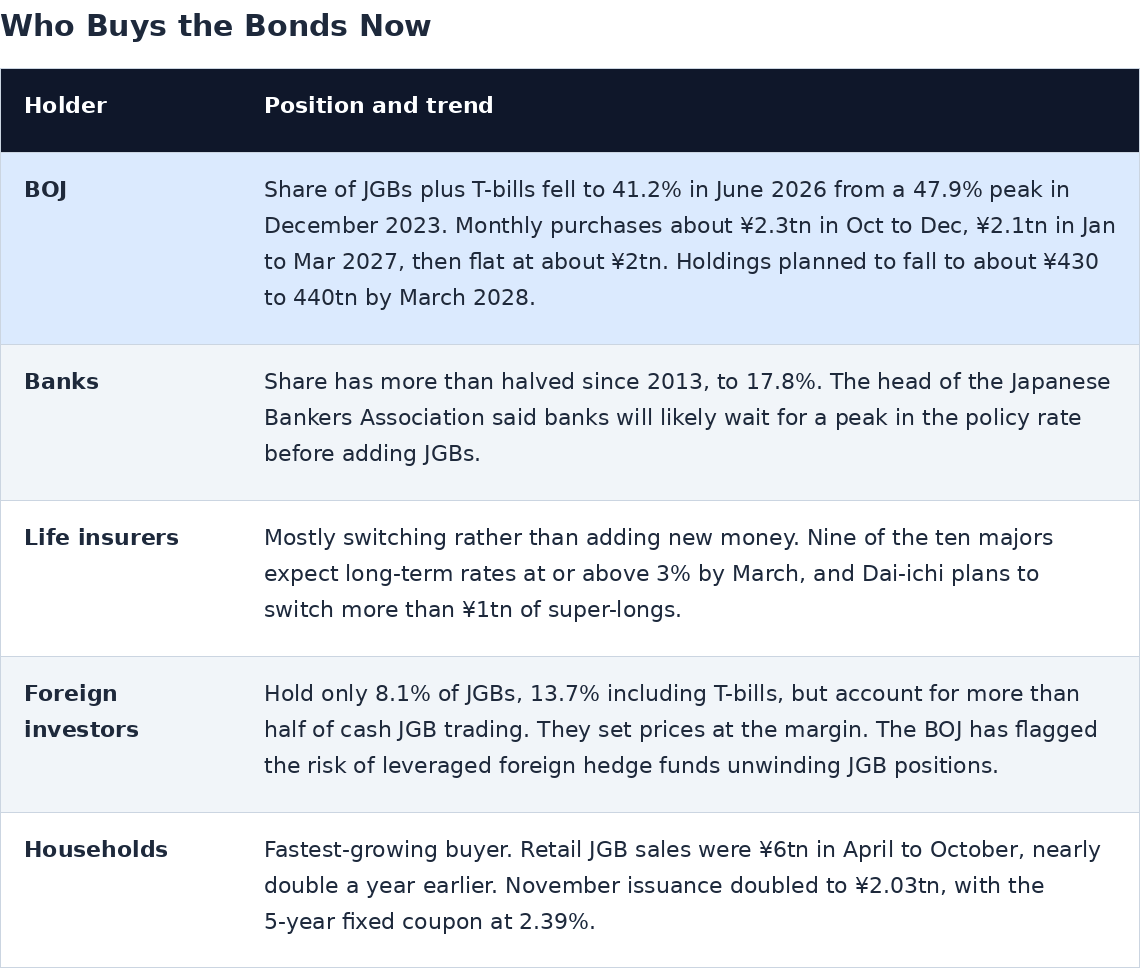
The pattern: the price-insensitive buyer, the BOJ, is stepping back, and the replacements, meaning foreign funds, households and insurers trading against their liabilities, all care about price. That is why the long end has repriced and why it remains volatile.
The deposit question
What the data actually show
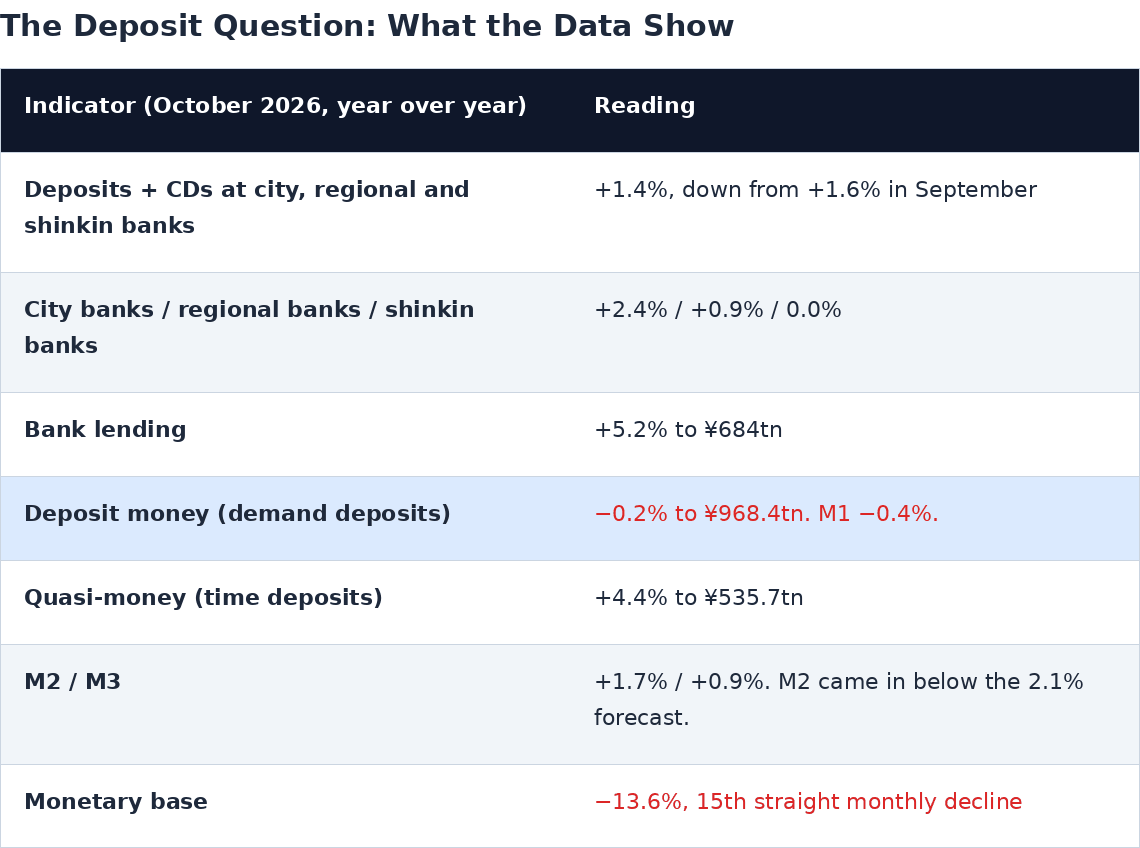
So "about to go negative" is accurate for parts of the system and early for the total. Demand deposits are already shrinking, shinkin banks are flat, and the BOJ reports that about 30 percent of regional banks and around half of shinkin banks have negative year-over-year deposit growth, in its April 2026 Financial System Report. Aggregate deposits are still growing, at about 1.4 percent, but the trend points toward zero, and the gap with lending growth is 3.8 points.
Why it matters for JGBs
The domestic-funding argument for Japan's debt has always rested on deposits. Households save in deposits, banks hold surplus deposits as JGBs or BOJ reserves, and the state borrows cheaply. Slowing deposits weaken that chain in three ways.
One. Less spare bank liquidity for bonds. With loans growing about four times as fast as deposits, the gap between deposits and loans that banks once parked in JGBs is shrinking. The BOJ notes that some banks have started issuing corporate bonds to diversify funding as growth in sticky retail deposits slows.
Two. Higher funding costs and less sticky deposits. The average deposit rate is about 0.44 percent, against more than 2 percent on retail JGBs. Banks that raise rates to compete attract money that is "less sticky," in the BOJ's words, and faster digital transfers are reducing stickiness generally.
Three. Policy tension. The banking lobby has already warned that a "rapid and excessive shift" from deposits into retail JGBs could weaken bank credit creation, Reuters reported. That creates political pressure against making retail JGBs more attractive, even though they are now the most dependable new buyer.
Where the money goes determines the outcome
Not every deposit outflow hurts the JGB market. The key question is where the money goes.
Deposits into retail JGBs, happening now. Neutral to positive for the government, negative for banks. Savings still fund the state, but directly rather than through banks. This is disintermediation, not flight.
Deposits into domestic equities and investment trusts. Neutral for the government. The BOJ notes that retail deposit growth is being offset by investments in stocks, investment trusts and JGBs.
Deposits into foreign assets, the real risk. With US 30-year yields above 5.3 percent and the yen near 160, a large move of household savings offshore would weaken the domestic funding base and the currency together. That combination has historically forced the BOJ to choose between defending the yen and defending the bond market.
Depositors are now shopping on price
Two shifts in how households hold money show that savers are comparing returns, not just parking cash.
From demand deposits to time deposits. In October, time deposits grew 4.4 percent while demand deposits fell 0.2 percent. The BOJ links this shift directly to rising deposit rates.
From deposits to direct JGB purchases. Retail JGB sales were ¥6tn in April to October, about double a year earlier, with coupons above 2 percent against about 0.5 percent on one-year deposits, Reuters reported. JPMorgan puts retail JGB purchases at 4.4 times the year-earlier level, with 20 percent of buyers under 30. In November, buyers preferred the 5-year fixed note at 2.39 percent over the 10-year floater at 2.05 percent. Choosing the fixed rate means locking in today's yield, which suggests buyers think rates are near their peak.
There is more evidence that savers are comparing rates.
Banks that pay higher deposit rates are gaining deposits faster. Deposits at internet-only banks grew 1.8 times from 2021 to 2026, against 1.1 times at regional banks.
Winning deposits is expensive. Aozora Bank grew deposits 7.4 percent, but its deposit cost rose 24.4 basis points.
Rate-driven deposits are fragile. The BOJ warns that deposits attracted with high rates are less sticky.
The shift is still early. Time deposits rose from 26 percent to 29 percent of deposits over two years, compared with 45 percent in the 2006 to 2007 hiking cycle. Government bonds are still under 1 percent of household financial assets, against about ¥1.13 quadrillion in cash and deposits. Most of the money has not moved yet. Because the remaining pool is so large, the trend matters more than the current amounts.
For banks, the cheap, sticky deposit base that funded them is turning into price-sensitive money. For the JGB market, a buyer that held bonds regardless of yield, banks recycling deposits, is being replaced by one that has to be paid to hold them, households buying directly. That supports a permanently higher floor under yields.
Where the money is going: gold, gold tokens and US equities
If savers are comparing prices, the question is which assets are winning. The data give a clear answer: foreign, mostly US, equities first, JGBs second, and gold barely at all.
Retail gold: net selling in physical, small gains in ETFs
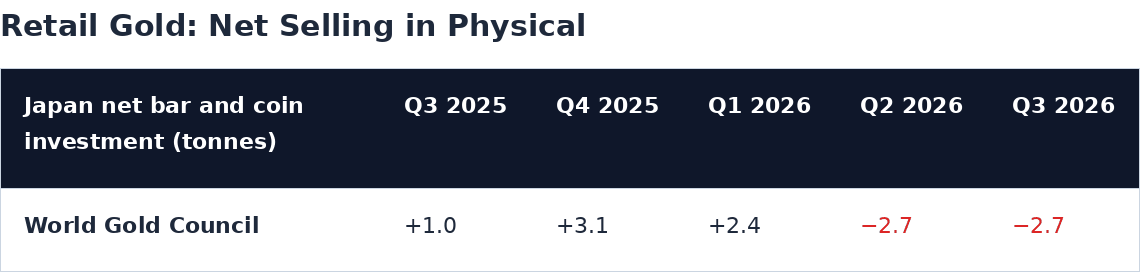
Physical gold is down from last year. Japanese households were net sellers of bars and coins in the second and third quarters, after net buying of 1.0 tonne in the third quarter of 2025. Year to date in 2026, net physical investment is about minus 3.0 tonnes. The World Gold Council says prices were high enough to keep long-standing holders selling but not attractive enough to bring in new buyers. Jewelry demand fell 25 percent year over year in the second quarter.
Price context. Tanaka Kikinzoku's retail selling price was ¥22,658 per gram on November 13, about 24 percent below the ¥29,969 tax-inclusive peak on March 3. Many households bought near the top in the first quarter and sold after the drop.
Gold ETFs show modest inflows that move opposite to JGB yields. Japanese gold ETFs added 5 tonnes in the first half of 2026, bringing holdings to 71.4 tonnes. The World Gold Council links Japanese ETF outflows in June and August to BOJ hikes and rising local yields, which raised the opportunity cost of holding gold, and inflows in September and October came as JGB yields fell. Japanese gold investors are clearly price-sensitive too: when bond yields rise, they sell gold.
Gold tokenization: real but tiny
Small and stuck. Mitsui's Zipangcoin, Japan's main regulated gold token, had ¥2.574bn outstanding at the end of June 2026. That is far below its ¥12bn three-year target and its ¥39bn issuance cap, and about 1/580th the size of the largest gold ETF, the 1540 fund at about ¥1.52tn.
No growth figure published. The balance has stayed around ¥2.5bn. Distribution is widening: Zipangcoin moved to the public OP Mainnet blockchain and listed on GMO Coin on April 20, 2026, and on Coincheck in August.
The main obstacle is tax. Gains on gold tokens are taxed as miscellaneous income at rates up to about 55 percent, compared with a flat 20.315 percent for gold ETFs. Tokens also have no NISA eligibility. A move to a flat tax of about 20 percent is being discussed for 2028 at the earliest but is not final. Until it passes, tokenized gold will not meaningfully pull money from deposits.
Foreign and US equities: the largest destination
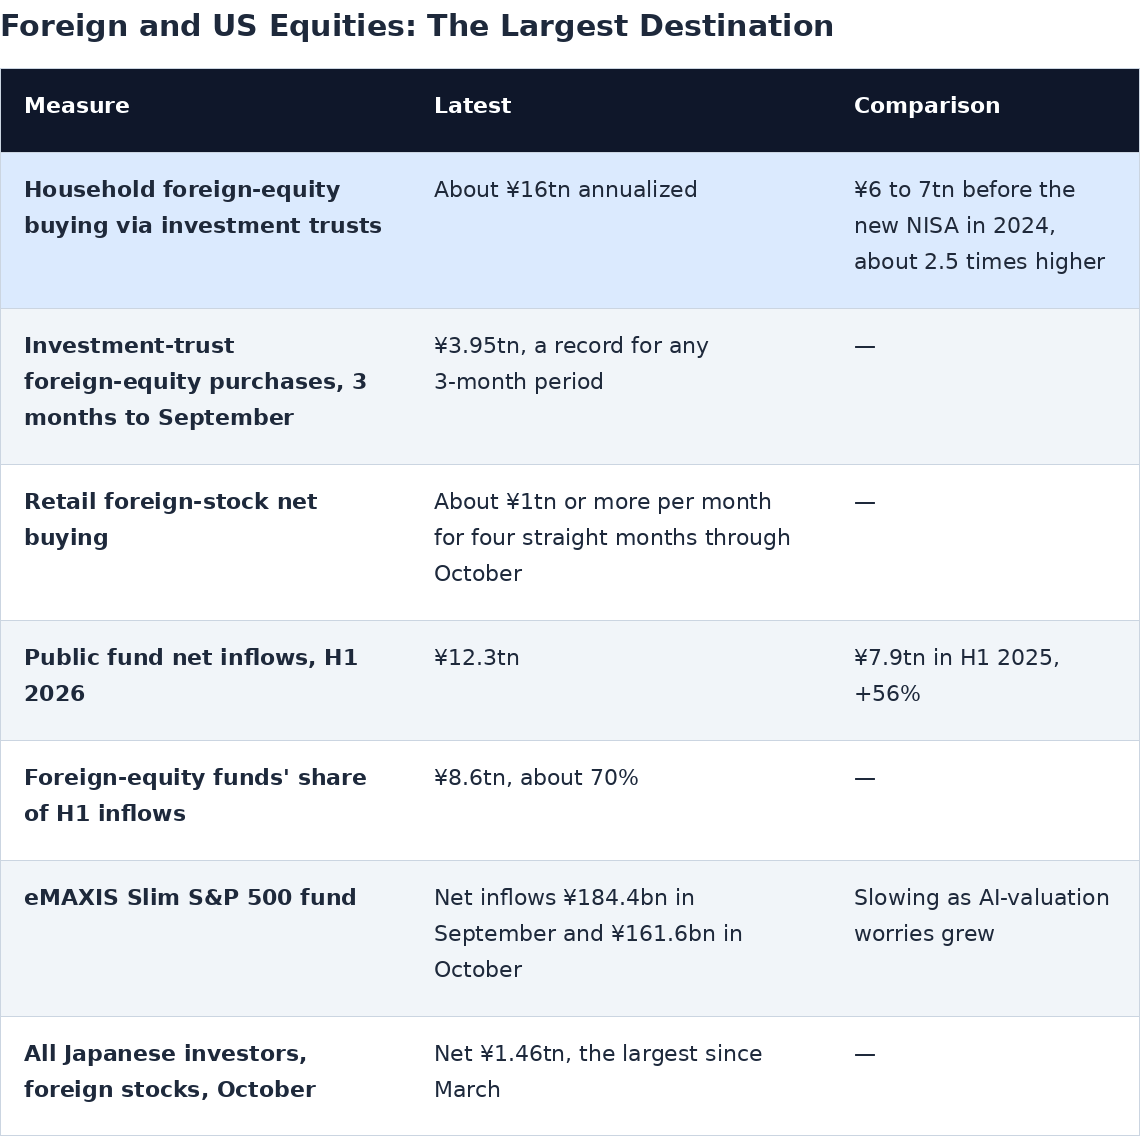
A caution on the US-specific numbers: the BOJ's by-country totals mix household buying with pension-fund rebalancing. Japanese purchases of US stocks were ¥1.91tn in January to April and ¥1.22tn through July after heavy selling in May, Reuters reported, with no year-over-year figure published. In the 12 months to August, households bought ¥11.9tn of foreign equities through investment trusts, while pension trust accounts sold ¥11.5tn. The household channel is the cleaner measure of depositor behavior. About 60 percent of global equity funds' holdings are US stocks, so the bulk of household foreign-equity buying ends up in US equities.
Putting it together
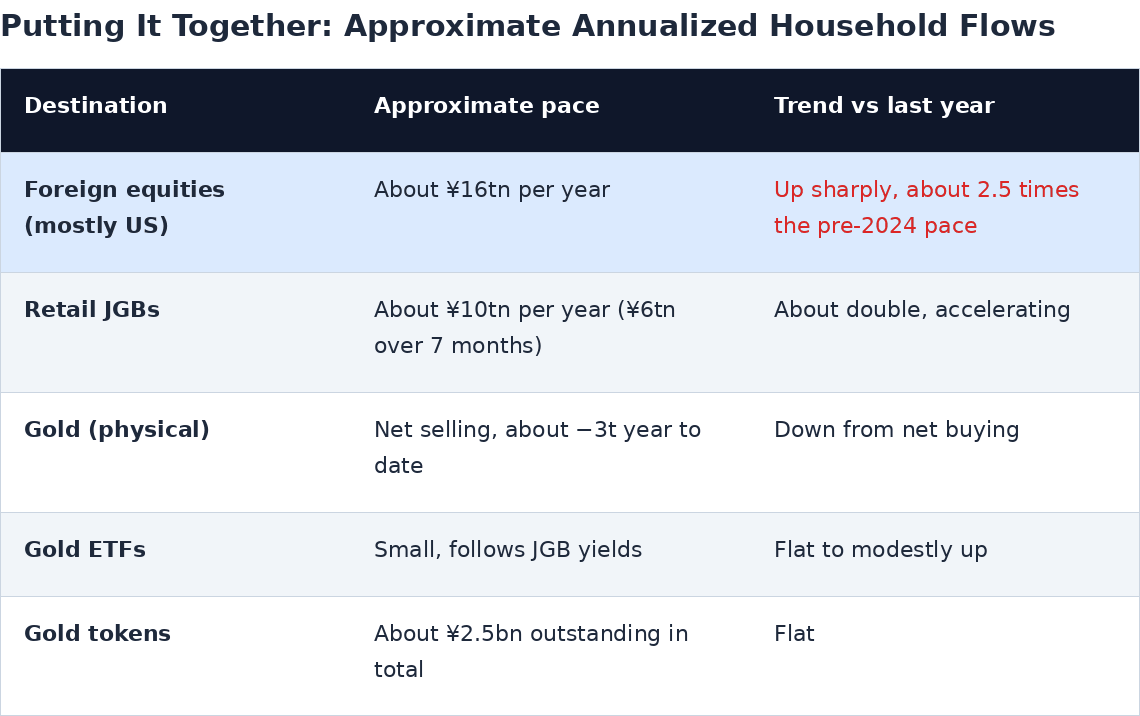
One. Savers are already moving money abroad. Japanese households are sending money overseas at a record pace and have been for two years. It hasn't hit the yen or JGBs harder only because pension funds are selling foreign assets on the other side and foreign investors are buying yen bonds, BofA notes. Both offsets can reverse. Pension rebalancing depends on market moves, and foreign buyers trade in and out.
Two. JGBs are winning more household money. Retail JGB buying is the fastest-growing flow, but it is still smaller than foreign equities. Each move higher in JGB yields shifts more money toward bonds, which is how the market stabilizes itself at higher yields.
Three. Gold is not where deposits are going. Japanese households are taking profits on gold, not using it to flee the yen. If gold buying picked up alongside a weakening yen, that would mark a new, more defensive stage of the shift out of deposits. It isn't happening yet.
Our reading of current evidence: the deposit outflow is split between JGBs and foreign equities, with foreign equities the larger share. The direction is clear. Savers are moving out of zero-rate deposits into higher-yielding deposits, retail JGBs and dollar equities. The next step is more dollar exposure. That makes a funding-base break the central risk, not a remote possibility.
Market structure: stocks, bonds and the yen
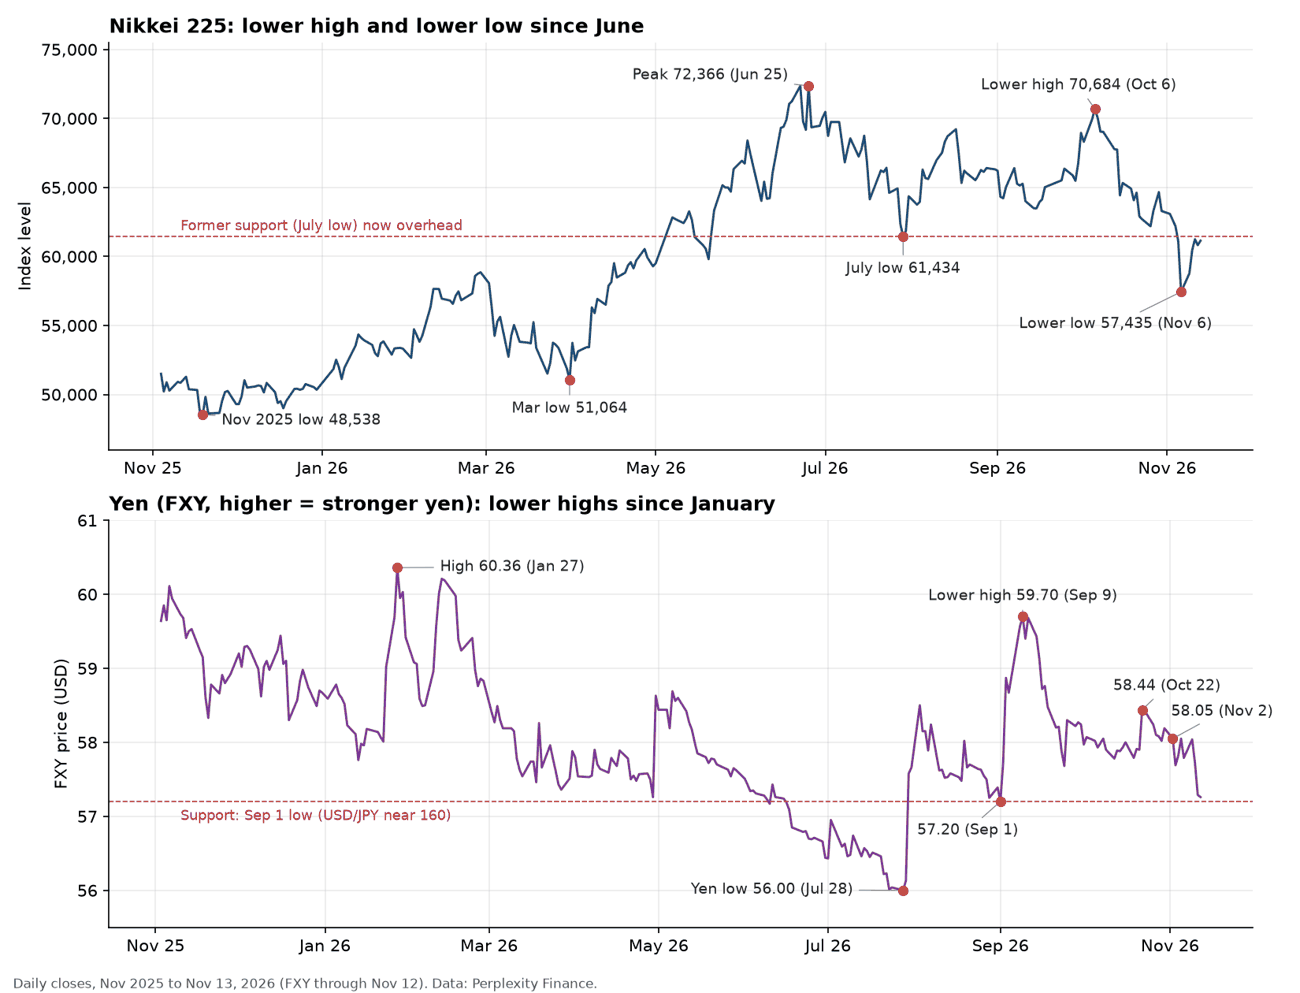
All three markets are weakening, but each has its own pattern and its own warning level. Equity and yen levels are daily closes from Perplexity Finance for the Nikkei 225, the EWJ and DXJ Japan equity ETFs, and the FXY yen trust.
Equities: the 3- and 6-month charts have broken down
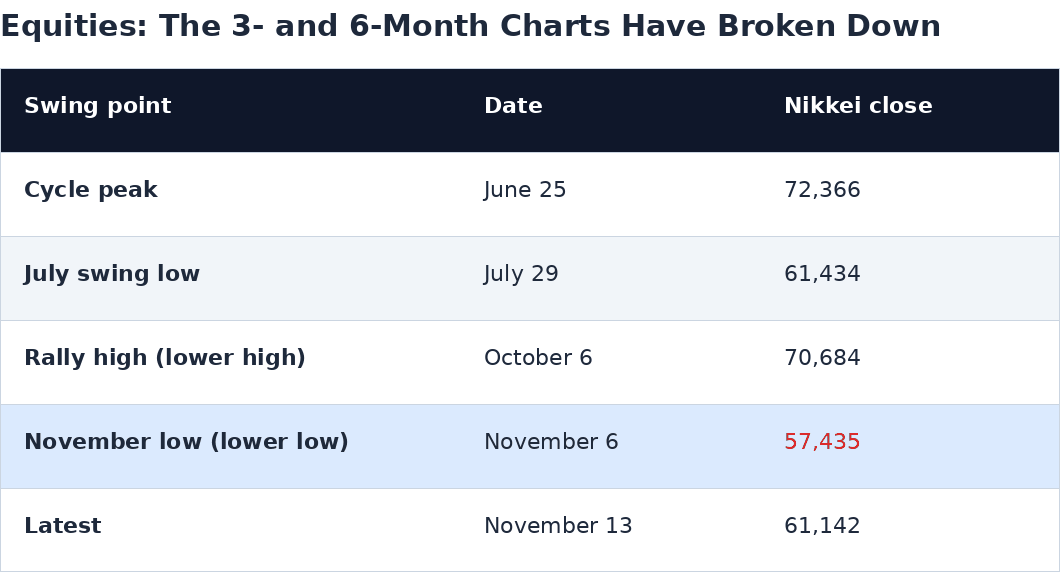
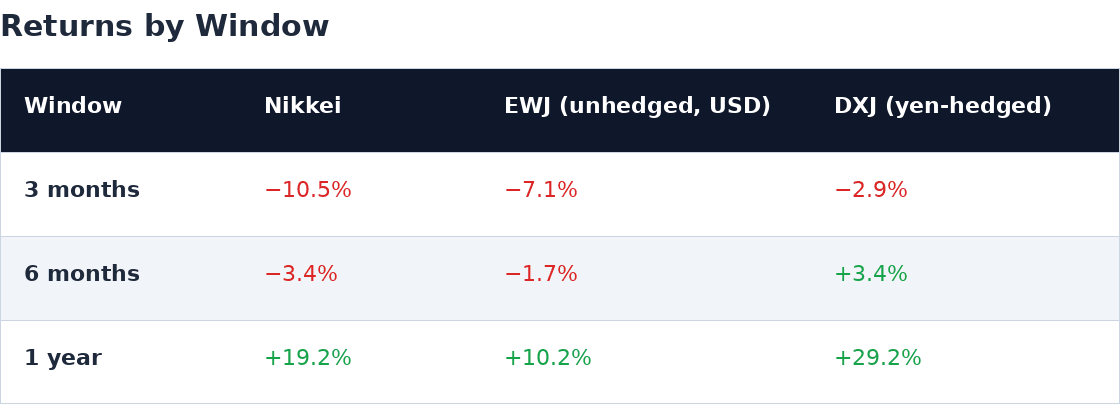
Lower high, then lower low. The October 6 high fell short of the June peak. The November 6 close was 6.5 percent below the July low, which confirms the break. From peak to trough the Nikkei fell 20.6 percent, which meets the common definition of a bear market. The week to November 6 alone took off 9.25 percent.
Old support is now resistance. The Nikkei closed November 13 at 61,142, just under the July low of 61,434. The test is whether the current bounce fails at that level.
The 1-year uptrend has not broken. The yearly lows are still rising: 48,538 in November 2025, 51,064 in March, then 57,435 in November. The 1-year trend breaks only on a move below the 51,000 to 57,000 zone.
The damage is concentrated in unhedged exposure. Unhedged dollar holders, through EWJ, broke their June low in November. The yen-hedged, exporter-heavy DXJ is still making higher lows. A weak yen props up exporters' earnings in yen terms, but foreign investors who carry the yen exposure take the loss.
Bonds: the long end is weakest
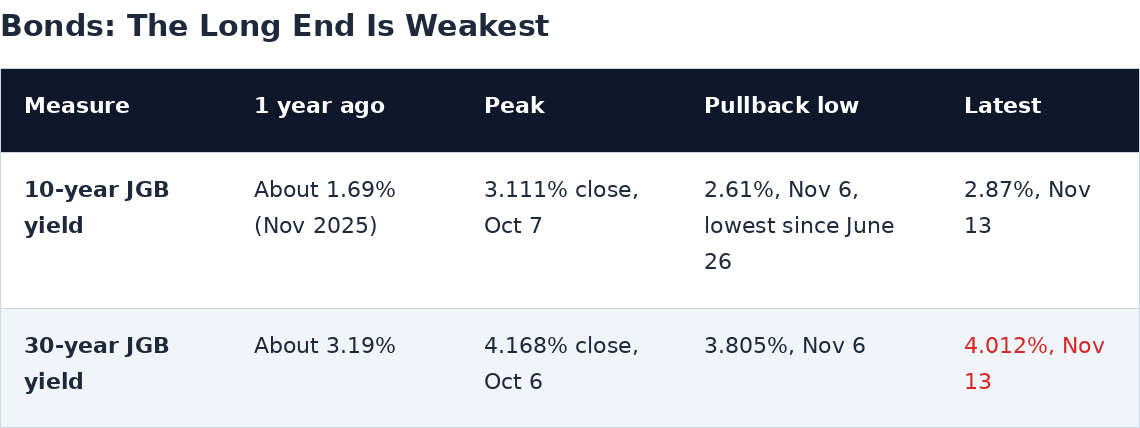
Yields move opposite to bond prices, so a bond-price breakdown shows up as higher highs and higher lows in yields.
One year: a clear bond bear market. The 10-year yield is up about 118 basis points and the 30-year about 80. The trend of higher yield highs and higher lows is intact.
Three to six months: the 10-year is range-bound, and the long end is leading. The November 6 flight to safety pushed the 10-year back to late-June levels, so its 3-month pattern is not a clean breakdown. The 30-year recovered faster. It is back above 4 percent, while the 10-year has not retaken 3 percent. The 10s30s spread has widened from about 106 basis points at the October peaks to about 114. This is the market charging a fiscal and supply premium on long debt. It is not repricing BOJ rate expectations.
Key levels. A 30-year close above 4.168 percent would be a new closing high and reopen the 4.235 percent intraday record. A 10-year close back above 3.111 percent would confirm a resumed uptrend across the curve. Retaking 2.61 percent on the downside would point to a wider flight-to-safety rally.
The yen: lower highs, with intervention defending the July low
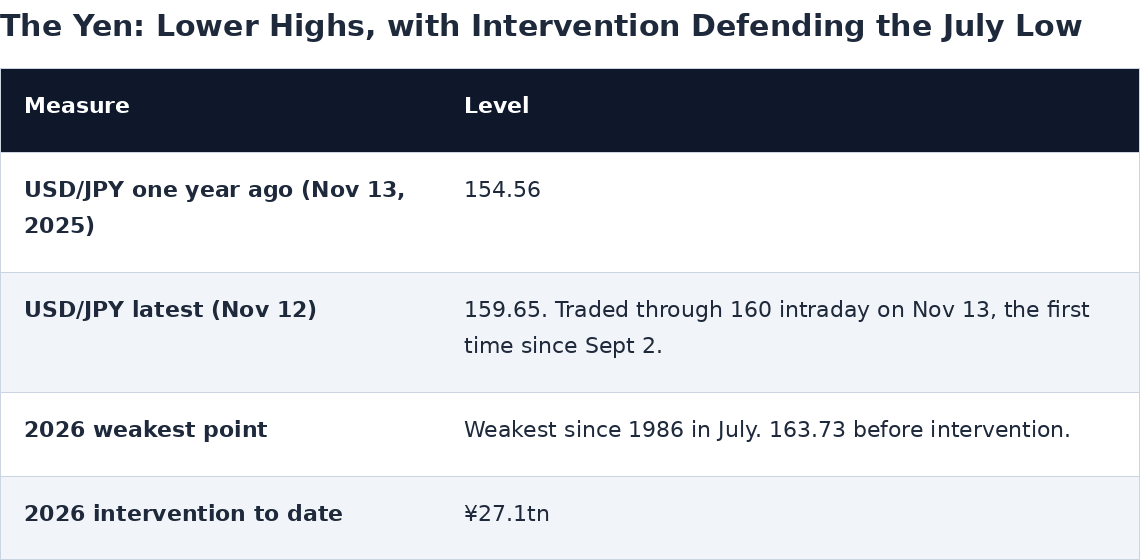
On the FXY yen trust, where higher means a stronger yen, the yen has made lower highs all year: 60.36 in January, 59.70 in September, 58.44 in October and 58.05 in early November. The July 28 low of 56.00 is the floor that intervention created. The yen is now testing its September 1 low of 57.20, which corresponds to USD/JPY near 160. Over 3, 6 and 12 months it is down 0.5, 1.6 and 3.8 percent against the dollar.
The yen is weakening even though Japanese yields have risen sharply, which is the fiscal warning in this chart. Normally higher domestic yields support a currency. When yields rise and the currency still falls, investors are demanding more to hold the country's debt, not being drawn in by it. Finance Minister Katayama has warned about one-sided moves. A sustained break above 160 would put the July levels of 162 to 164 back in play and probably bring further intervention.
Reading the three together
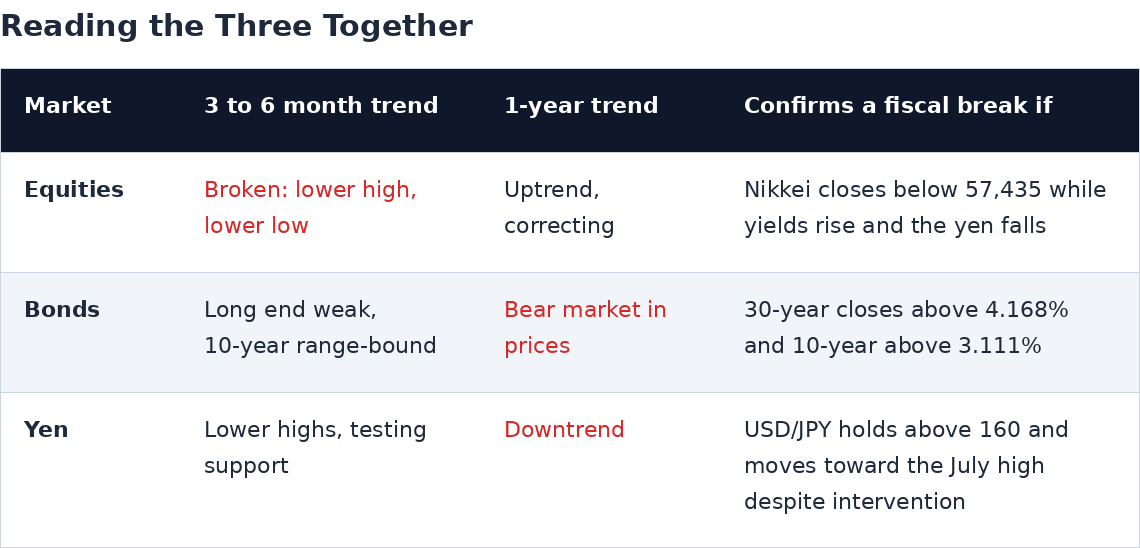
This is the strongest market evidence so far that the fiscal squeeze is spreading beyond the bond market. Stocks and bonds have not yet fallen on the same days for a fiscal reason. When the AI-driven selloff hit on November 6, JGBs still rallied as a safe haven. The pattern to watch is all three markets falling together: stocks down, yields up and the yen weaker on the same days. Japan's fiscal calendar runs through the December BOJ meeting and the FY2027 budget, and if that pattern appears in that window, it would mark the move from a slow squeeze to a credibility problem.
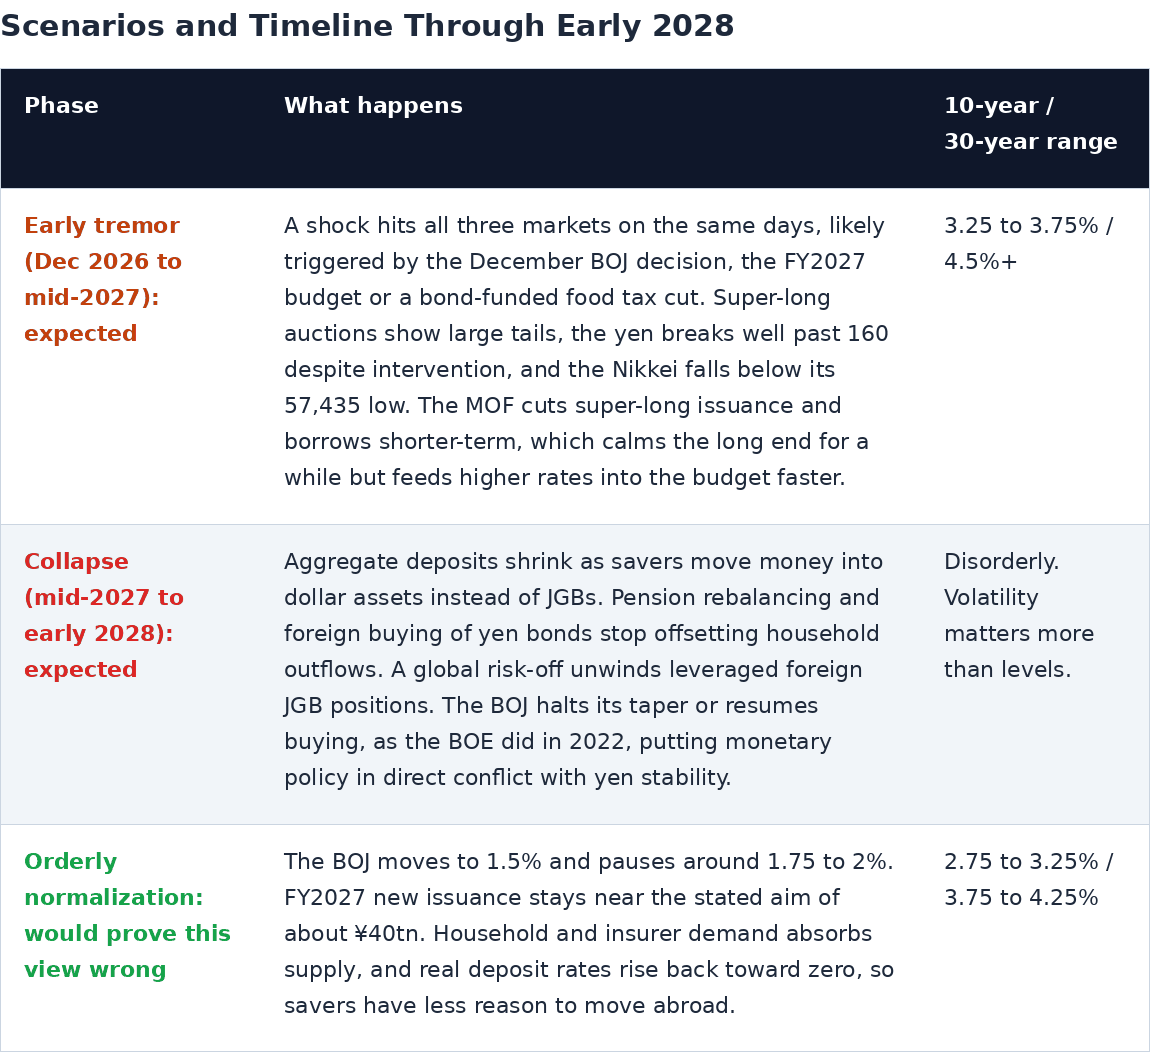
Scenarios and timeline through early 2028
These are analytical judgments, not forecasts from the sources cited.
What to watch
One. The BOJ's December meeting. A hike to 1.5 percent would confirm the faster new phase that dissenter Takata argued for. A hold paired with a yen above 160 would raise the fiscal-dominance question.
Two. The final FY2027 budget, in late December. Watch the assumed interest rate, whether 3.8 percent or into the 4 percent range, total new JGB issuance against the roughly ¥40tn aim, and how the food tax cut is funded.
Three. Super-long auctions. Bid-to-cover ratios below about 3 times and tails wider than 3 basis points would signal demand is giving out.
Four. The December deposit and lending release. In the BOJ's principal figures in early December, watch whether the deposits-plus-CDs aggregate falls below 1 percent, whether shinkin turns negative, and whether city-bank growth keeps slowing.
Five. The money destination. Compare monthly retail JGB sales with outbound investment-trust flows. The first is manageable. The second is the warning signal.
Six. Monthly Ministry of Finance tax receipts. If growth of about 12 percent holds, a FY2026 total near ¥90tn is plausible, giving room on the debt. A slowdown in corporate tax, the fastest-growing source at plus 30.9 percent, would be the first sign of a turn.
Seven. Gold behavior. Japanese gold buying, physical or ETF, rising while the yen weakens and JGB yields climb would point to savers seeking protection, not just yield. Also watch the year-end tax reform outline for the 20 percent crypto and gold-token tax.
Eight. USD/JPY above 160 and US long yields. Japan imports global term premium. Recent JGB moves have mostly followed US Treasuries, Reuters reported.
Conclusion
The trends in this report all point in one direction. Japanese savers no longer accept zero.
They are moving on every front. Out of demand deposits into time deposits, out of deposits into retail JGBs, and above all into dollar equities.
The dollar is winning. Household foreign-equity buying runs at about ¥16tn a year, mostly into US stocks, compared with about ¥10tn for retail JGBs.
Yen cash loses money. With deposit rates of about 0.44 percent against inflation above 2 percent, Japanese savers lose money in real terms every year they stay in yen cash.
The next move for the average saver is more dollar exposure. Dollar deposits and US Treasuries offer higher rates, and dollar equities offer growth that yen assets do not. Every yen that leaves the domestic system weakens the deposit base that has funded the government for thirty years.
Tokyo faces an impossible choice. Support the economy with bond-funded tax cuts and spending, and the bond market and the yen pay for it. Restore fiscal discipline, and growth, asset prices and the political coalition pay for it.
The likely response is to choose neither and avoid the decision. The government keeps spending, relies on inflation to boost revenue, and lets the markets do the adjusting. That is already visible: the 30-year has broken 4 percent, the yen is making lower highs even as yields rise, and the Nikkei has made a lower high and a lower low. All three markets are tightening financial conditions that policy will not.
The outlook is that all three markets are nearing a breaking point.
Early shock: December 2026 to mid-2027. Expect it around the December BOJ meeting and the FY2027 budget. Its signature would be stocks, JGBs and the yen falling on the same days for a fiscal reason, not an AI or global one.
Broader collapse: mid-2027 to early 2028. As household money moves offshore, the domestic buyer base erodes and the cushions now absorbing the outflow give way. Those cushions are pension rebalancing, foreign bond buying, BOJ purchases and the tax-revenue windfall from inflation.
We have been warning since January 2026. The warning chart at the top of this report marks the three dates, January 21, March 10 and October 2. The bond call has held since the first one: the 30-year yield has risen from 3.65 percent to 4.012 percent. The equity call has held since the October 2 alert, with the Nikkei down 10.5 percent from 68,309 to 61,142, although the index remains about 16 percent above its January 21 level. The yen has weakened from 158.3 to 160 per dollar.
The recommendation is to avoid these markets.
Long-dated JGBs. The 20- to 40-year bonds carry the most direct exposure to a rising fiscal premium.
Unhedged Japanese equities. They combine a broken chart with currency risk.
Yen cash and yen deposits. They earn a negative real return while the currency remains the pressure valve.
What would change this view: a credible FY2027 budget that funds its tax cuts, real deposit rates rising back toward zero, and a 30-year yield that holds below 4 percent while the yen strengthens. Without those, a 30-year above 4 percent is more likely the floor for yields than the ceiling.
This report reflects the authors' analysis and opinions and is not individualized investment advice or a recommendation to buy or sell any security. The scenarios and timeline are analytical judgments and may prove wrong. Figures are drawn from the Ministry of Finance, the BOJ, the IMF, the World Gold Council and market and press sources believed reliable but not independently verified.
The authors hold positions in securities mentioned and reserve the right to buy or sell shares at any time without notice.