
19 for 19: Why Last Week's Election Shouldn't Scare You Out of Stocks


Divided government, a whiplash week and what a century of data says about selling on the headlines.
Last Tuesday, voters handed Democrats both chambers of Congress. On Wednesday, the Dow had its best post-midterm day in 44 years. On Thursday, more than $2 trillion in tech stock value vanished in one session.
If you spent the weekend with your thumb hovering over the sell button, this one's for you. What happened last week has happened exactly four times before since World War II, and history has a clear message about it.
Election week, in three acts
On November 3, Democrats won control of both the House and the Senate, one of the most lopsided midterm results in modern history. As of this weekend, the AP count has Democrats at 54 Senate seats to 44, with Alaska and Mississippi still uncalled, and 254 House seats to 162 with 19 races outstanding. For the final two years of President Trump's term, Washington is now a divided government.
The market's reaction was a whiplash week.
Wednesday: relief. The Dow jumped about 1,569 points, or 3 percent, its biggest post-midterm day since 1982 according to CFRA Research. The S&P 500 rose about 1.6 percent, oil fell sharply, and bond yields dropped.
Thursday: fear. Investors worried a Democratic Congress and statehouses would clamp down on AI and data-center expansion. The S&P 500 fell 4.4 percent, the Nasdaq fell 5.5 percent into correction territory, and the VIX fear gauge spiked about 70 percent.
Friday: a partial bounce. Chip stocks recovered some losses after a stronger-than-expected jobs report. The S&P 500 closed at 7,376.86, down about 2.7 percent for the week, its worst week since June.
A bad week feels like a verdict. It isn't. Even after Thursday, the S&P 500 is still up roughly 8 to 9 percent for 2026 on a total-return basis. Here's what the longer record says.
A century of data: the market doesn't vote
Stocks have climbed under Democratic and Republican presidents, and under every combination of who controls Congress. Dimensional Fund Advisors charts a hypothetical $1 in the S&P 500 from 1926 onward, shaded by the party in the White House. It grows from $1 to well over $10,000, with red and blue stretches both pointing up. Their companion chart, shaded by control of the House and Senate, tells the same story.
Academic work agrees. A Federal Reserve Bank of San Francisco study of 1871 to 1997 found stock returns were almost identical under both parties and rejected the old Wall Street belief that markets prefer Republicans. Over 1926 to 1997 the averages were 15.1 percent a year under Democratic presidents and 10.7 percent under Republican ones, a gap the authors did not treat as meaningful.
Why? Shareholders own companies, not parties. Earnings, interest rates, innovation and recessions drive prices far more than who holds the gavel. Notice also that both parties' supporters have, at different times, been convinced the other side would wreck the market. Selling on that conviction has been expensive for both.
The midterm streak nobody talks about
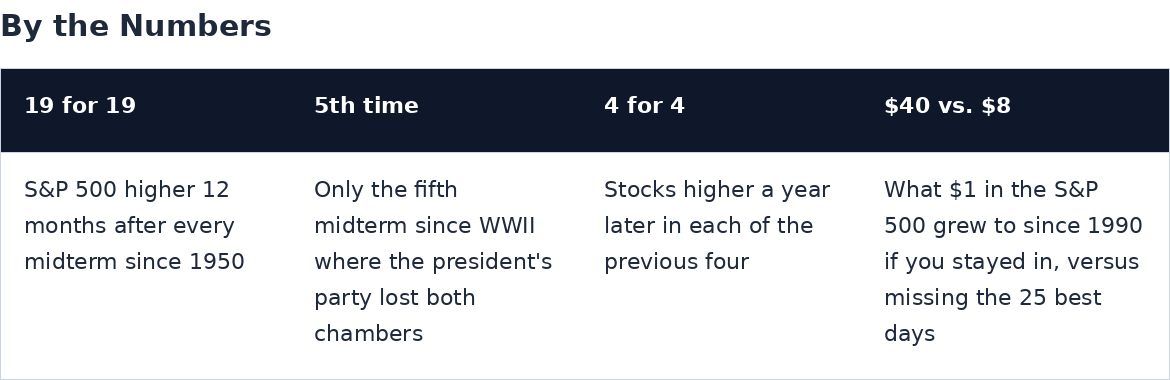
The S&P 500 has been higher 12 months after every midterm election since 1950, 19 for 19. The weakest year in that run was still positive.
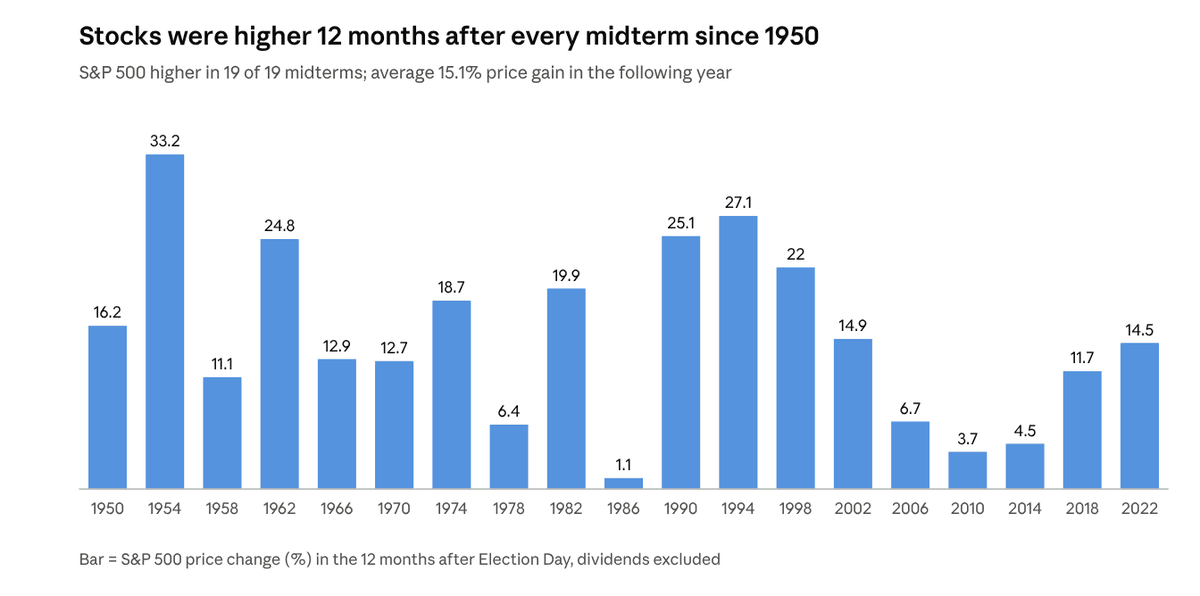
The longer record is less perfect, which is worth knowing. Going back to 1874, stocks rose in the year after 32 of 38 midterms, averaging about 14 percent against 11 percent for a typical 12-month stretch. The worst years, 1906, 1930 and 1902, came ahead of the Panic of 1907, during the Great Depression, and in an economic slowdown. Those were economic events, not election outcomes.
The graphic going around social media, 10 for 10 midterms from 1986 to 2022 with a 13.1 percent average price gain, lines up with this data. The usual explanation: markets hate uncertainty, and once the votes are counted, a big source of it is gone.
We've seen this movie four times before
A president losing both the House and Senate in one night is rare. Since World War II it has happened only four times before last week, twice to each party. Here's what the S&P 500 did over the next 12 months.
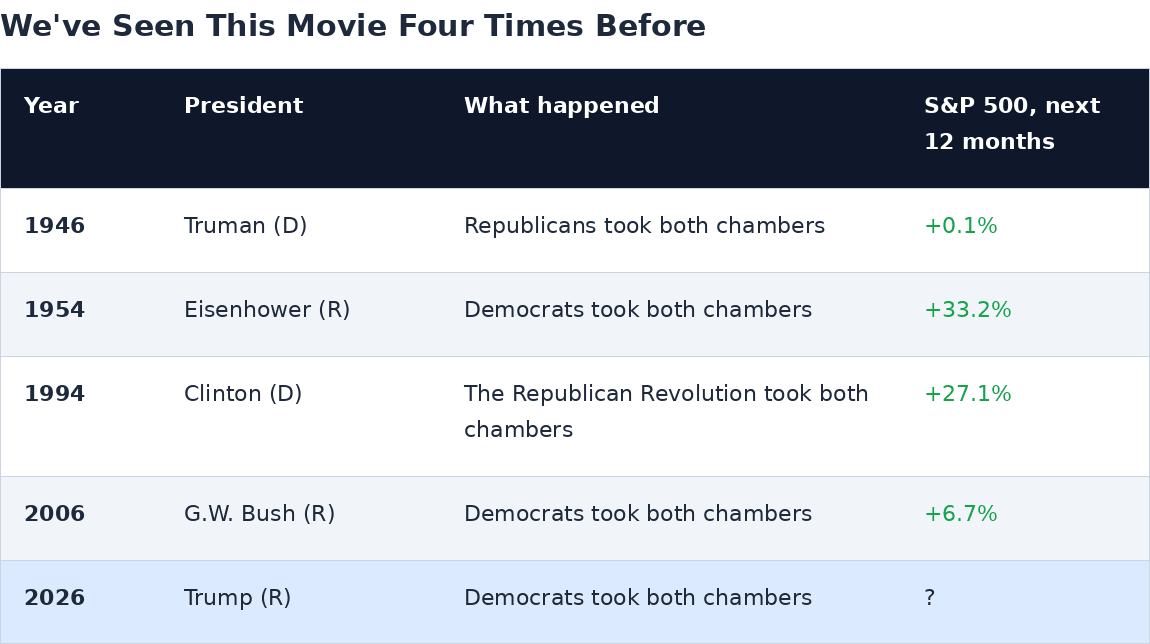
The closest parallel to today is 1954, when a popular Republican president lost Congress to Democrats. The year that followed was one of the best for stocks of the entire postwar era.
The unfiltered footnote: it was never a smooth ride. Even 1954's 33 percent year included an 11 percent drop along the way. And after 2006, the 2008 financial crisis took the index about 51 percent below its election-day level by March 2009. That crash came from housing and banks, not from Congress, which is exactly the point: the economy moves markets, not the scoreboard in Washington.
Why Wall Street quietly loves gridlock
Last week produced a Republican president facing a Democratic Congress. Historically, that setup has been one of the friendlier ones for stocks. Here's the Motley Fool's breakdown of the 12 months after every midterm since 1874.
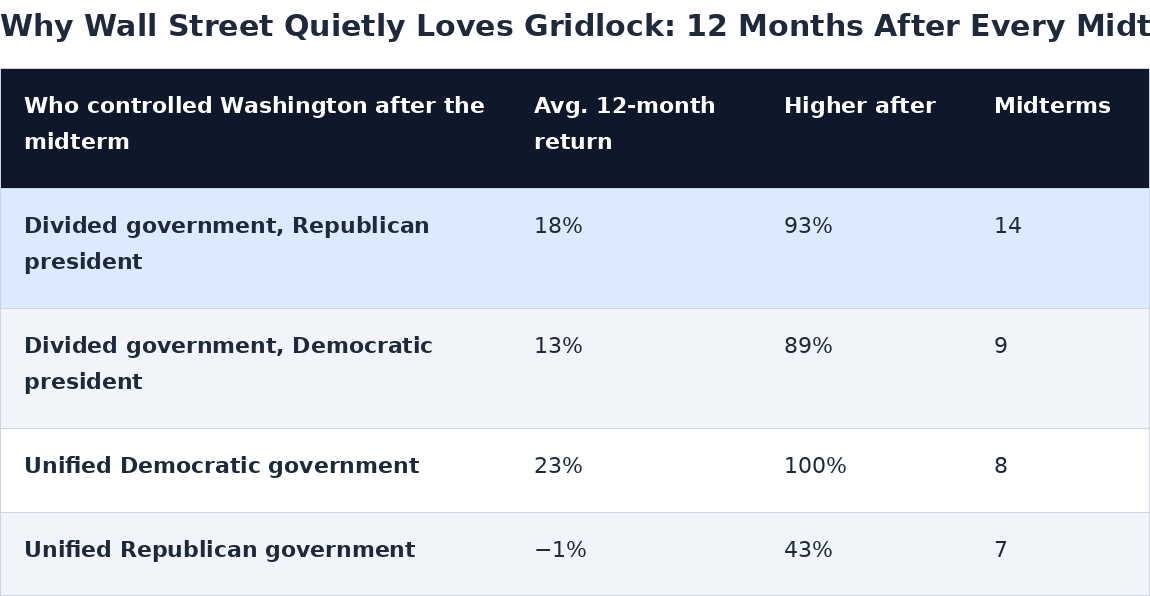
Don't read these as a party scorecard. The samples are small, and the unified Republican number is dragged down by 1902, 1906 and 1930, years that led into financial panics with little to do with Congress. The useful point is narrower: divided government overall averaged 16 percent and was positive 91 percent of the time.
The size of the wave didn't matter either. When the president's party lost 40 or more House seats, the next year still averaged 11 percent and was positive 88 percent of the time. As Fidelity's Jurrien Timmer put it last week: "Markets like gridlock and that's what we got." A Congress that checks the White House tends to mean fewer sudden policy shocks, and markets price predictability.
The unfiltered part: what history can't promise
I'd be doing you a disservice if I stopped at the good numbers. History is reassuring, not a guarantee.
Small samples. 19 midterms since 1950 is not much data, and interest rates, earnings and recessions were at work in every one of them.
Positive years still had scary stretches. In the year after the 1986 midterm, the S&P 500 fell about 33 percent from August to October 1987, the Black Monday crash, and still finished slightly higher.
Sectors can diverge from the index. Last week's selloff was concentrated in AI and chip stocks over fears of tighter regulation of data centers. Policy can matter for specific industries even when it washes out for the broad market. If your portfolio is heavy in one theme, that's a concentration question, not an election question.
The real drivers are still economic. Friday's strong jobs report raised the odds of a Fed rate hike. Inflation, rates, earnings and the situation with Iran will likely move markets more over the next year than any vote in Congress.
None of this argues for selling. It argues for owning a portfolio you can sit through when a 4 percent down day shows up.
So what should you actually do?
Probably less than you feel like doing.
Here's the stat that should stick with you. Since 1990, $1 left in the S&P 500 grew to about $40. Miss just the 25 best days over those 35-plus years, and it grew to about $8. The catch: the best days tend to land right next to the worst ones, in the same panics. Last week was a live demo. Wednesday's big rally and Thursday's big drop came 24 hours apart. Anyone who sells after a day like Thursday is often gone for the bounce.
One. Separate your vote from your portfolio. You can be thrilled or furious about last Tuesday. Neither feeling tells you what earnings will be in 2027.
Two. Check your time horizon, not the headlines. Money you need in the next year or two shouldn't be in stocks anyway. Money for 10-plus years out has historically been rewarded for staying put.
Three. Rebalance instead of reacting. If last week's swings pushed your mix off target, nudging it back is a disciplined move. Dumping everything is not.
Four. Keep contributing. If you invest on a schedule, a down week means your next contribution buys more shares.
Five. Watch for concentration. If one sector, like AI, is a huge chunk of your holdings, diversify on its own merits, not because of who won.
The chart going around social media says it best: selling stocks based on which party has power has historically been a big mistake. Washington changed last week. The long-run case for patient investing didn't.
This is general education, not personal financial advice. I'm not a financial advisor. Past performance doesn't guarantee future results, so talk to a licensed professional about your own situation.