
The Real Rate on the 99-Year Clock (Technical Report)


The First True Test of the Colossus Doctrine
Opposite starts, one meeting point, a war-driven split, and the one-and-done hike that puts 2026 back on 1927. A JD Unfiltered Special Report by Joseph M. Salvani and Daniel J. Walsh. The 1921 to 1930 / 2020 to 2029 Market Analog Series. Clock convention: May 1921 = May 2020, 1927 = 2026.
In one paragraph
From May 1921 and May 2020 the real interest rate started from opposite ends of the map: roughly +19% in a collapsing-price economy then, roughly 0% and heading to −6% in a reopening economy now. By 1925 to 1926 and 2024 to 2025 the two series had met inside a few tenths of a point. In 2026 they split again, but this time the 1920s line moved up and the 2020s line stayed low, because an Iran war put oil above $100 while 1927 saw crude collapse. Everything else on the clock, meaning equities, productivity, labor and money, is still tracking. That leaves one reading: the market and the economy are treating the Middle East dislocation as temporary. If the clock holds, the gap closes through lower inflation, a higher 10-year, or both. We expect the mechanism to be a one-and-done short-rate increase this week under the Bessent/Warsh Accord, followed within weeks by a much larger step-up in long-bond buybacks from the $6 billion Bessent has already reached, followed by falling oil, visible service-sector deflation by year-end, and a first cut by March 2027. The 1927 shot of whisky was a rate cut. The 2026 version is a rate rise that pulls the 10-year down and gives Bessent's long-end plan the bill demand it needs. And because a productivity boom raises the return on capital, the real rate climbing back into the 3 to 5% range is the bullish outcome, not the bearish one.
Executive Summary
The measurement. We define the real rate as the long government bond yield less the trailing twelve-month change in consumer prices, month by month, for May 1921 to December 1930 and January 2020 to August 2026. The 1920s series averages 5.39%. The 2020s series averages −0.79%. Only 4 of 116 months were negative then. 38 of 80 have been negative now.
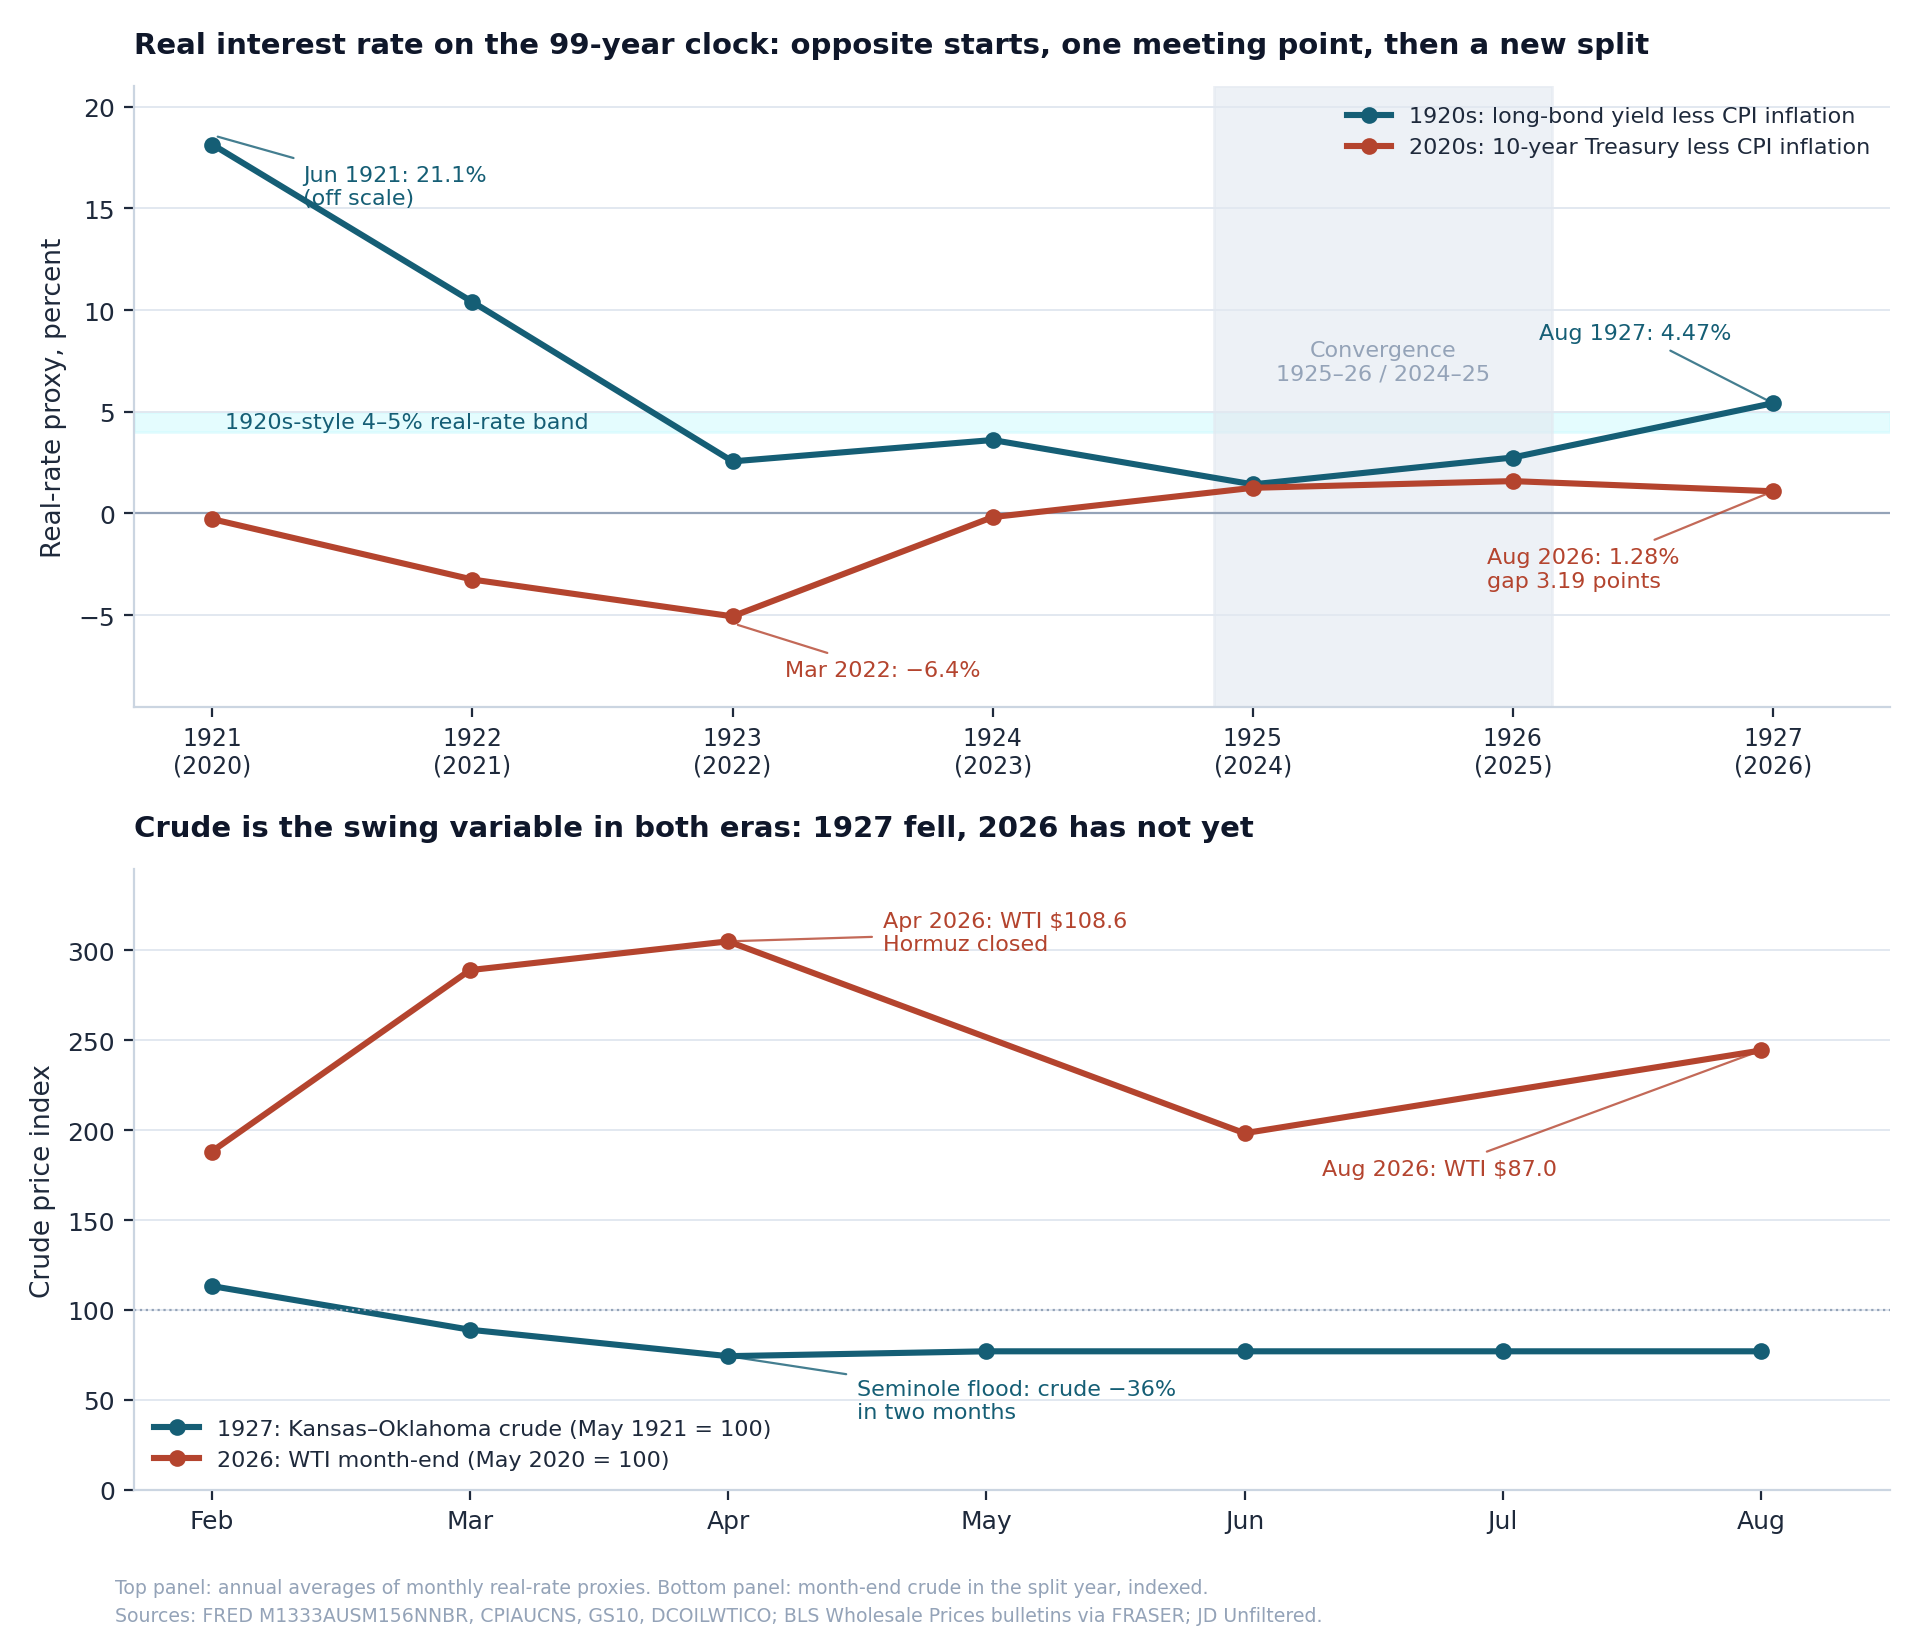
Opposite starts. June 1921 printed a 21.1% real rate as prices fell 16% against a 5.3% bond. March 2022 printed −6.4% as prices rose 8.5% against a 2.1% bond. Two decades could not have begun further apart.
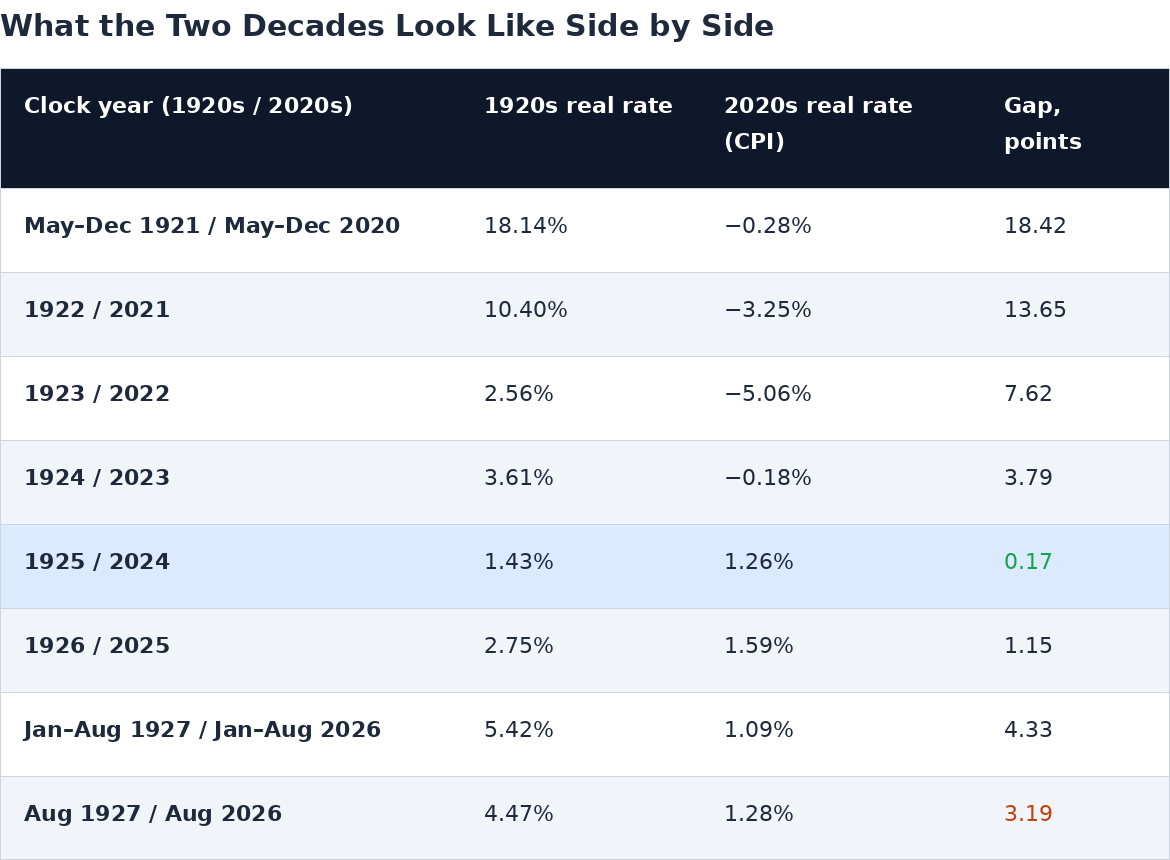
One meeting point. On the 99-year alignment the 1925 real rate averaged 1.43% and 2024 averaged 1.26%, a gap of 0.17 points. 1926 averaged 2.75% and 2025 averaged 1.59%, a gap of 1.15 points. The convergence the model called for happened on schedule.
The 2026 split. January to August 1927 averaged 5.42%. January to August 2026 averaged 1.09%. August 1927 stood at 4.47%, a 3.32% yield less −1.15% inflation. August 2026 stood at 1.28%, a 4.68% yield less 3.40% inflation. The gap is 3.19 points, and it opened in March 2026 when the Iran war took WTI from $67 to $109 in two months.
Oil is the swing variable in both eras. The 1927 real rate rose because the Seminole field flooded the market and Kansas-Oklahoma crude fell 36% in March and April 1927, pulling the price level negative. The 2026 real rate fell because the Strait of Hormuz closed and crude rose. Same variable, opposite sign. Everything else on the clock still fits.
The market is treating the dislocation as temporary. The 10-year has risen about 50 basis points since February while headline CPI rose a full point. Equities, credit and the productivity data have not repriced for a permanent inflation regime. That is the behavior of a market that expects the war premium to leave the price level.
Closing the gap. To return to the 1927 level of roughly 4.5%, either twelve-month inflation falls to about 0.2% with the 10-year unchanged, the 10-year rises to about 7.9% with inflation unchanged, or some combination. We expect the inflation path with a lower 10-year, which is exactly the 1927 configuration: a 3.3% bond and a slightly falling price level.
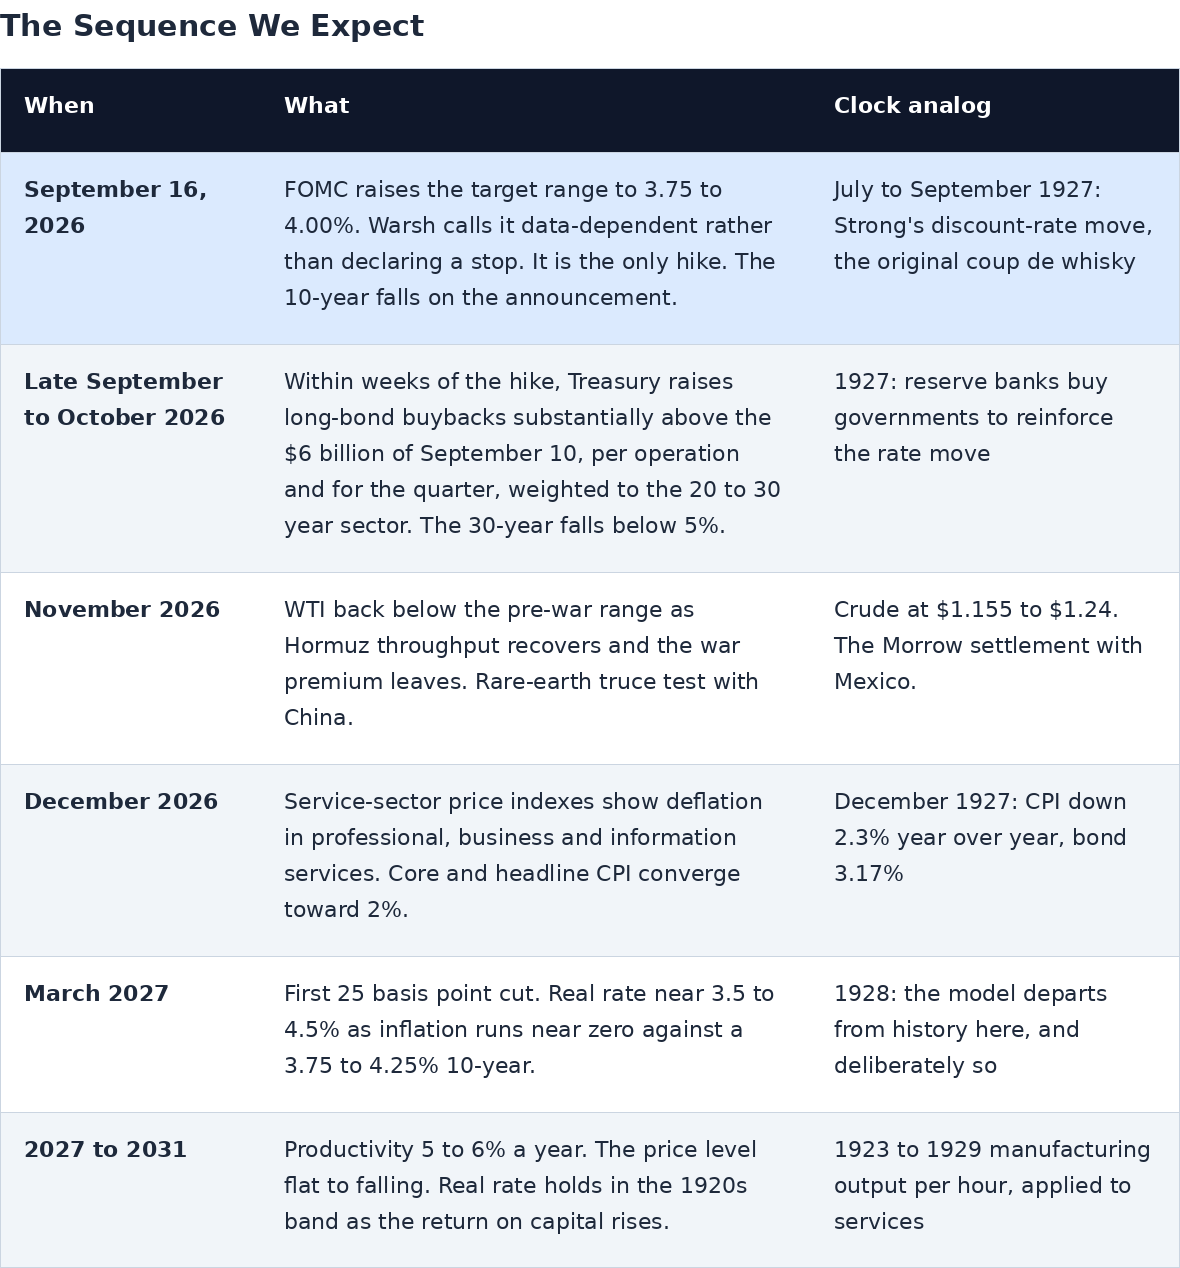
The policy path. We expect the FOMC to raise the funds rate 25 basis points to 3.75 to 4.00% on September 16, and to stop. A higher bill rate pulls global dollars into GENIUS Act stablecoins, dampens inflation expectations, and gives Treasury cover to take long-bond buybacks well past the $6 billion operation of September 10. Bessent has already tripled the long-dated size from $2 billion to $6 billion, and we expect him to raise it by a much larger amount within weeks of the hike. If the Colossus Doctrine is right, Warsh is using the one move to give a strong bid to Bessent's plan: the higher bill rate is what pulls dollars into the front end that funds the buybacks. The market is more sensitive to the 10-year than to the 3-month, so the hike is the shot of whisky, a rise in short rates that produces a large fall in the long rate.
A 3 to 5% real rate is very bullish here. Productivity booms raise the return on capital, and income shifts from labor inputs toward capital inputs. The natural rate rises with it. If AI is to services what electrification was to the factory, and the evidence says it is more productive, a real rate moving into the 3 to 5% range is the equilibrium rate catching up with the economy, not policy restraint. The 1927 to 1929 melt-up ran at real rates of 3.6 to 5.3%. The late-1990s bull market ran at 3.5 to 4.0%. A 1% real rate against a 5 to 6% productivity trend is the anomaly, and the move to 3 to 5% is the signature of the 1928 = 2027 leg, not the risk to it.
Then the disinflation engine takes over. Service-sector deflation, the price expression of AI reaching 72% of employment, should be visible in the data by year-end. Productivity of 5 to 6% a year through 2027 to 2031 is the base case set out in The Scissors Labor Market, and it does a second job: a productivity boom raises the return on capital, so a real rate moving up into the 3 to 5% range is the natural rate rising with the economy, not policy tightening. It is bullish. Warsh has cast AI as a new factor of production and wants a real rate in the 1920s range of 4 to 5%, and the way to get there is falling prices, not rising bonds. Oil should be lower by November if the clock is intact. The first cut arrives by March 2027.
The Measurement
The real rate in this report is a proxy, built the same way in both eras so the two lines can be laid on top of each other. It is the nominal long government bond yield for the month, less the twelve-month percentage change in the consumer price index for the same month.
For May 1921 to December 1930 the yield is the NBER monthly series of long-term United States government bond yields and the price index is the BLS Consumer Price Index for All Urban Consumers, not seasonally adjusted. For January 2020 to August 2026 the yield is the 10-year constant-maturity Treasury, monthly average, against the same CPI series, which printed 334.980 for August 2026, a 3.4% twelve-month rise. A parallel 2020s series against the PCE price index runs about 0.4 points hotter on the real rate because PCE inflation runs about 0.4 points cooler than CPI. The CPI basis is used throughout this paper so that both decades are measured against the same index.
Three caveats travel with every number. The 1920s bond composite is partly tax-exempt and callable within 8 to 12 years, so it is not a true 10-year. The 1920s CPI is published to one decimal, which puts about ±0.3 points of noise on any single month. The October 2025 CPI was never published because of the federal shutdown and is interpolated between September and November. None of these change a 3-point gap. All of them should discourage anyone from reading a tenth of a point as signal.
What the two decades look like side by side
Opposite Starts, One Meeting Point
The 1921 economy was liquidating a wartime price level. Consumer prices fell about 14% in the year to May 1921 and about 16% in the year to June, while the government bond composite yielded 5.25 to 5.27%. The real rate was therefore 19 to 21%, a punishing figure that squeezed debtors and farmers, and the reason the 1920 to 21 slump is remembered as one of the sharpest deflationary recessions on record. From that peak the real rate fell steadily as deflation ended: to about 10% for 1922 as a whole, 2.6% for 1923, and 3.6% for 1924.
The 2020 economy was doing the opposite. The 10-year Treasury averaged 0.6 to 0.9% through the reopening, and by the time the price level began to move the bond had barely responded. The real rate went from roughly zero in the pandemic months to −3.3% for 2021 and −5.1% for 2022, bottoming at −6.4% in March 2022 when CPI inflation touched 8.5% against a 2.1% 10-year. It turned positive in June 2023 and has stayed positive since, with one exception in the spring of 2026.
Two lines starting 20 points apart met in 1925 to 1926 and 2024 to 2025. The 1925 average was 1.43%. The 2024 average was 1.26%. The 1926 average was 2.75%. The 2025 average was 1.59%. In November 1925 and November 2024 the 2020s series was actually higher than the 1920s series, the widest reading in that direction. The model did not require the two decades to travel the same road. It required them to arrive at the same place at the same clock time, and they did.
That convergence deserves a moment, because the two paths had nothing in common. One was a deflation being cured by recovery. The other was an inflation being cured by tightening. The economies met at a real rate of one to two points because both had reached the same phase of the cycle: prices stable, growth strong, bond yields near the level at which they would sit for the rest of the boom. In the 1920s that level was 3.3 to 3.7%. In the 2020s it is 4.0 to 4.7%.
The 2026 Split and What It Says
From January 1927 the 1920s line jumped to 5.7%, then 6.3%, 6.2%, and 6.7% by April, before settling at 4.4 to 5.5% for the rest of the year. The bond did not move. It drifted from 3.51% to 3.17%. The whole rise came from the price level, which went from −1.1% to −3.4% year over year by April 1927. The 1927 real rate was high because prices were falling, and prices were falling in large part because crude oil collapsed. The Seminole field in Oklahoma came into full flow and Kansas-Oklahoma posted prices dropped from $1.70 a barrel in February to $1.335 in March and $1.114 in April, a 36% fall in two months, according to the BLS Wholesale Prices bulletins held at FRASER. Crude sat at $1.155 from May through August 1927, 23% below its May 1921 level.
From March 2026 the 2020s line did the opposite. The 10-year rose from 4.13% in February to 4.68% in August, but CPI inflation rose faster, from 2.41% to 4.25% in May before easing to 3.40% in August. The real rate fell to 0.23% in May, its lowest since 2023, and stood at 1.28% in August. The cause is the same variable with the opposite sign. The United States and Israel attacked Iran in late February 2026. WTI went from $67.0 at the end of February to $102.9 at the end of March and $108.6 at the end of April, fell to $70.6 in June as tankers moved, and was back at $87.0 by August. By September 11, Reuters reported crude again above $100 and diesel above $6 a gallon.
So the 3.19-point gap between August 1927 and August 2026 decomposes cleanly. About 1.4 points is the higher nominal bond, 4.68% against 3.32%, which is a permanent feature of the modern series and was present through the convergence years. The remaining 4.6 points of the gap is the difference between a price level falling 1.15% and one rising 3.40%, and of that, the swing in energy since February accounts for most of the movement. The August CPI report attributed more than a third of the monthly increase to gasoline alone, with other motor fuels up 44% year over year. Core CPI was 2.4%.
Why the market is telling us the dislocation is temporary
If investors believed a 3 to 4% inflation regime had arrived, the 10-year would carry it. A 4.7% bond against 3.4% inflation is a 1.3% real yield. A market pricing permanent 3.4% inflation and a normal 2% real yield would put the 10-year near 5.4%. Instead the bond has risen about half as much as inflation since February, and equities have continued to track the 1927 leg of the clock. Credit spreads on the hyperscalers widened in August but did not break. Productivity growth was 2.2% in the year to the second quarter with unit labor costs up only 1.2%, on the BLS Productivity and Costs release. Everything except the oil-driven price level is where the clock says it should be. The market has decided that Hormuz is a war premium and not a regime, and Treasury Secretary Bessent has said the same in plain terms, telling CNBC on August 31 that this is a supply shock and that you do not traditionally raise rates into one absent second- or third-order effects.
The Colossus Doctrine reached the same conclusion from the money side in its reply to the Volcker Mark II thesis. M2 growth in the mid-single digits is consistent with a Hormuz and Black Sea supply shock, not a monetary one. A supply shock leaves the price level once supply returns. The real-rate gap is therefore a measure of how much war premium the price level is carrying, and it should close from the inflation side as the premium leaves.
The Arithmetic of Closing the Gap
If the clock is to keep its record, the 2026 real rate must move toward the 1927 level of roughly 4.5%. There are only three ways to get there, and it is worth being explicit about the numbers.
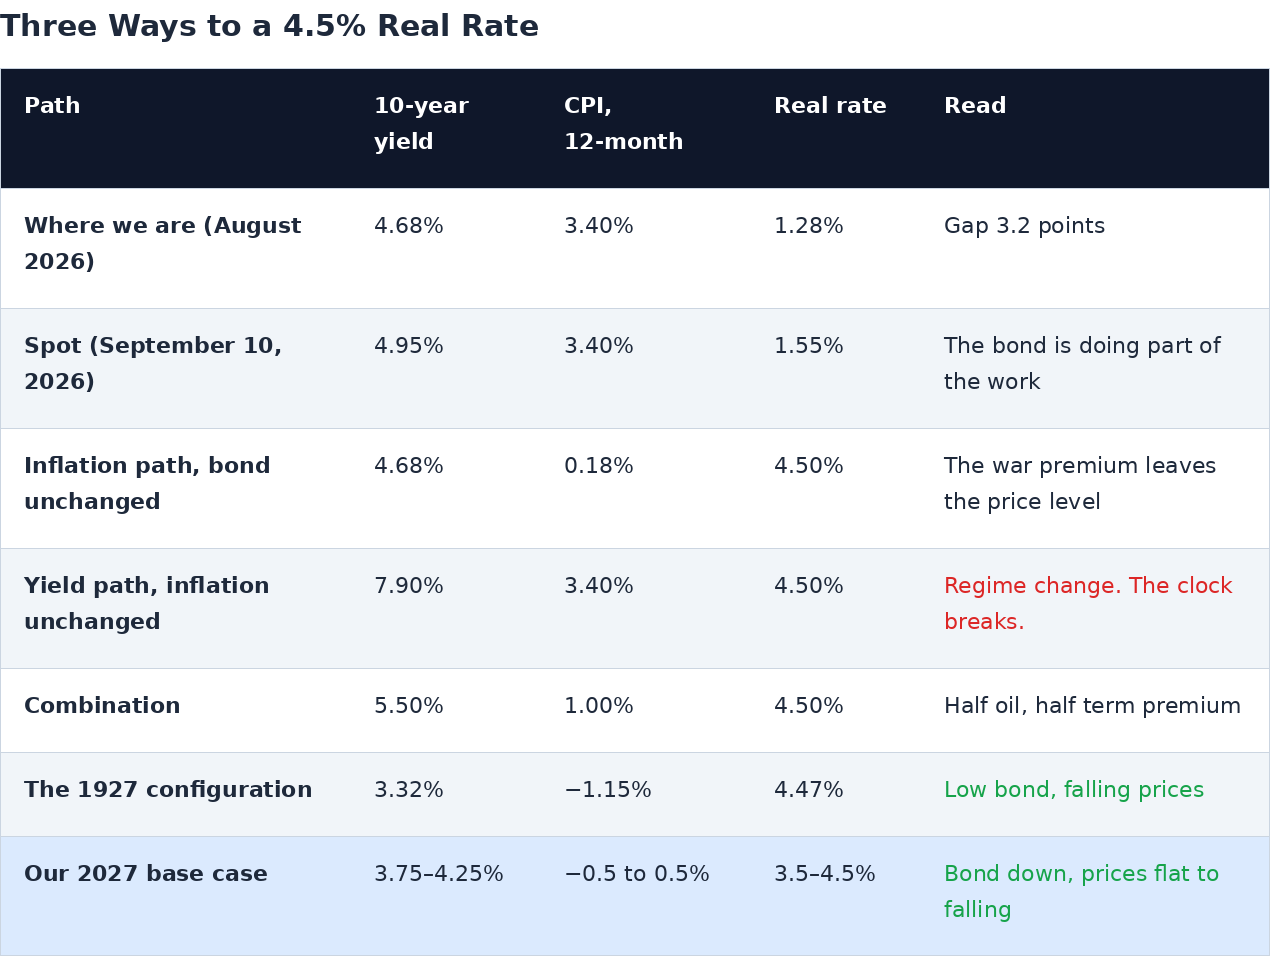
The yield path is the one that would falsify the model. A 10-year near 8% with 3.4% inflation would mean the market had abandoned the productivity story, and none of the rest of the clock would survive it. The combination path is plausible for a few months, since the 10-year touched 4.99% on September 11 and the 30-year sits at 5.37%, the highest since 2007. But the destination that matches 1927 is the inflation path, and it is the one the policy mix is now built to deliver.
The Policy Path: The Bessent/Warsh Accord
The Bessent/Warsh Accord is the Doctrine's name for the division of labor that has been visible since Kevin Warsh took the oath as Federal Reserve chairman on May 22, 2026. Treasury manages duration. It funds itself at the front end, where money funds and GENIUS Act stablecoin reserves are price-insensitive buyers, and it retires long bonds. The Fed manages the short rate and inflation expectations, and does not fight the Treasury's long-end operation. It is the 1951 Accord run in reverse: instead of the Fed being freed from pegging Treasury's long rate, Treasury takes responsibility for the long rate so that the Fed can concentrate on the short one.
On August 19 Treasury doubled its 10 to 30 year buybacks to at least $4 billion per operation and doubled the frequency to four operations a quarter, effective September 9 and running through November 4, a day after the 30-year yield hit a 19-year high. The next day Bessent said the figure could exceed $4 billion per issue. He was as good as his word. On September 9 Treasury announced it would buy up to $6 billion of 10 to 20 year debt the next day, triple the $2 billion that had been the normal long-dated operation, and it bought $5.187 billion. The market shrugged. The 10-year rose to 4.85%, its highest since November 2023, and the 30-year pushed through 5.3%. Bessent's own framing was that he cannot change the equilibrium price and is only trying to slow things down, and ING called the operation an opening gambit. That is the right reading. The long end is not rejecting the tool. It is telling Treasury that the size is too small to matter until the Fed has delivered the other half of the Accord, and that once the Fed has, the size will matter a great deal.
So the sequence is Fed first, Treasury second, and Treasury bigger. Warsh will not announce that the hike is one and done. He will describe it as data-dependent, and the market will price a second move for a few weeks. We expect Bessent to move within weeks of the FOMC decision to a buyback program on a substantially larger scale than the $6 billion operation, both per operation and in total for the quarter, concentrated in the 20 to 30 year sector where the yield damage has been done. That is the point at which the hike and the buyback stop being two policies and become one. The bill demand the hike creates is the funding. The buyback is the use. The larger the Treasury step, the clearer the message that the short-rate move was not the beginning of a cycle but the price of admission to a long-end operation that the Fed is now underwriting with its reaction function.
The one-and-done
We expect the FOMC to raise the target range 25 basis points to 3.75 to 4.00% at the September 15 and 16 meeting. Markets moved to price it after Warsh's Jackson Hole speech, in which he said the Fed's predominant focus right now should be on prices, noted twelve-month PCE inflation of 3.7% and a six-month rate of 4.1%, and warned that otherwise the Fed has work to do. After the August CPI, futures priced roughly a 90% probability of a September hike, with economists split on whether more follow. The 3-month bill at 3.86% on September 10 is already above the top of the current range.
The case for one hike and then a stop rests on three effects, none of which requires a second hike to work.
One. It slows a strong underlying economy at the margin. A 3.75 to 4.00% funds rate against 2.4% core inflation is a real short rate of about 1.5%, restrictive enough to lean against the demand side without starving the capital spending Warsh himself highlighted: business equipment and intangibles investment growing 9%, its fastest since 2021, with more than half of 2026 capex growth attributable to AI build-out.
Two. It pulls global dollars into U.S. stablecoins. GENIUS Act issuers hold reserves in bills. Aggregate dollar-stablecoin capitalization has reached roughly $300 to $322 billion, more than double the end-2023 level, and the Federal Reserve put the reserve pool at $317 billion in April with 53% of Tether and Circle assets in bills. A higher bill rate widens the spread a token issuer earns against a foreign deposit paying nothing, which is what drives distribution. Every dollar that migrates into a token is a dollar of rollover bid for the bills that fund the buybacks.
Three. It resets inflation expectations before they embed. The hike says the Fed will not accommodate a supply shock into wages. That is the second- and third-order effect Bessent named, and one hike is enough to demonstrate the reaction function. Warsh's own standard is that underlying inflation must move to target clearly and at sufficient speed.
The shot of whisky, inverted
In July 1927 Benjamin Strong hosted Norman, Schacht and Rist on Long Island and then led the reserve banks to cut the discount rate from 4% to 3.5% between late July and mid-September, a move he called a little shot of whisky for the stock exchange. The 2026 version runs the other way at the short end and the same way at the long end. A short-rate rise that the market reads as one-and-done removes the inflation term premium from the 10-year. Treasury's buybacks, stepped up well beyond the $6 billion September 10 operation, remove supply from the 20 to 30 year sector at the same time. The result is a lower long rate produced by a higher short rate.
This works because the market is more sensitive to the 10-year than to the 3-month. Mortgages, corporate issuance, equity discount rates and the dollar all key off the long end. A 25 basis point move in bills changes almost nothing in the real economy. A 50 to 75 basis point fall in the 10-year changes everything. The Doctrine's reply to the Volcker Mark II thesis argued that a bills-for-bonds swap adds nothing to M2 and cannot be debasement. The same logic says the swap can lower the long rate without adding to inflation, which is precisely what the real-rate gap requires: a lower nominal bond while the price level falls, converging on the 1927 configuration from above.
The sequence we expect
The Disinflation Engine
The one-and-done hike buys time. What closes the gap is the price level, and the price level is about to receive the same treatment manufacturing received in the 1920s. The Scissors Labor Market set out the case: manufacturing output per hour rose about 5.6% a year from 1919 to 1929 while manufacturing employment did not grow, and the sector being electrified today is services, which employs 72% of Americans. Applying a 1920s-scale sector gain to a sector three times the weight produces an economy-wide productivity number of 5 to 6% a year for 2027 to 2031, against a 2.1% cycle average to date. The Fed's own retrospective on productivity booms describes the 1920s aggregate as roughly 3.75% a year in the 1917 to 1927 burst.
The price expression of that gain is service-sector deflation. In the 1920s the falling price of electric power and of manufactured goods pulled the whole index negative from mid-1926 through 1927 even as output and employment rose. Today the falling price is inference, and it is falling far faster than electricity did. The early tells are in the second-quarter productivity report: output up 1.7% with hours up 0.3%, unit labor costs up 1.2% against compensation up 2.6%. We expect the service components of the CPI, which have been carrying the index above 3%, to begin showing outright declines in professional services, information and administrative categories by the December report, and to spread through 2027 as outcome-based pricing replaces the billable hour in a $2 trillion slice of the economy.
What Warsh wants
Warsh is a firm believer in this mechanism. At Jackson Hole he described AI as potentially a new factor of production and cited token sales for the two leading labs running above $100 billion annualized, up more than 500% in a year. A central banker who believes a productivity boom is arriving does not want to meet it with a 1% real rate. A 1% real rate in a 5 to 6% productivity economy is a call-loan boom waiting to happen. The 1920s real rate of 4 to 5% was not tight money. It was a stable nominal bond sitting above a falling price level, which is what a productivity boom looks like when the central bank lets the gains reach consumers as lower prices. Our reading is that Warsh cares about arriving at that 4 to 5% real rate, and that he understands the only way to arrive at it without breaking the economy is from the inflation side. The hike this week is the first and last move at the short end that the plan requires. The rest is done by the price level, by Treasury at the long end, and by the stablecoin bid that makes the long-end operation fundable.
The Bullish Case for a 3 to 5% Real Rate
Most readers hear rising real rates and reach for the 1981 playbook: the central bank squeezes, credit is rationed, and the economy is pushed into recession to break inflation. That is one way a real rate gets to 5%. It is not the way the 1920s got there, it is not the way the late 1990s got there, and it is not the way 2027 will get there. The distinction is the oldest one in the theory of interest. The natural rate is set by the return on capital, and the market rate follows it. When a new factor of production arrives, the marginal return on capital jumps, the demand for capital investment rises, and the real rate that clears saving against investment moves up with it. A real rate rising for that reason is a symptom of a boom, not a brake on one.
The mechanism runs through the income shares. High productivity shifts output from labor inputs toward capital inputs, because the new capital is doing work that labor used to do and doing it more cheaply. Returns to capital rise, and the price of the goods and services the capital produces falls. A stable nominal bond sitting above a falling price level is exactly what a rising real rate looks like in that world, and every point of it is a point of return that the economy is now able to pay. The 1920s show it. Manufacturing output per hour rose about 5.6% a year from 1919 to 1929, the real rate ran between 4% and 5% for most of the decade, and the decade delivered one of the strongest peacetime expansions on record. High real rates did not choke the boom. They were the price of admission to it, because electrified capital earned more than it cost.
Three ways to a high real rate
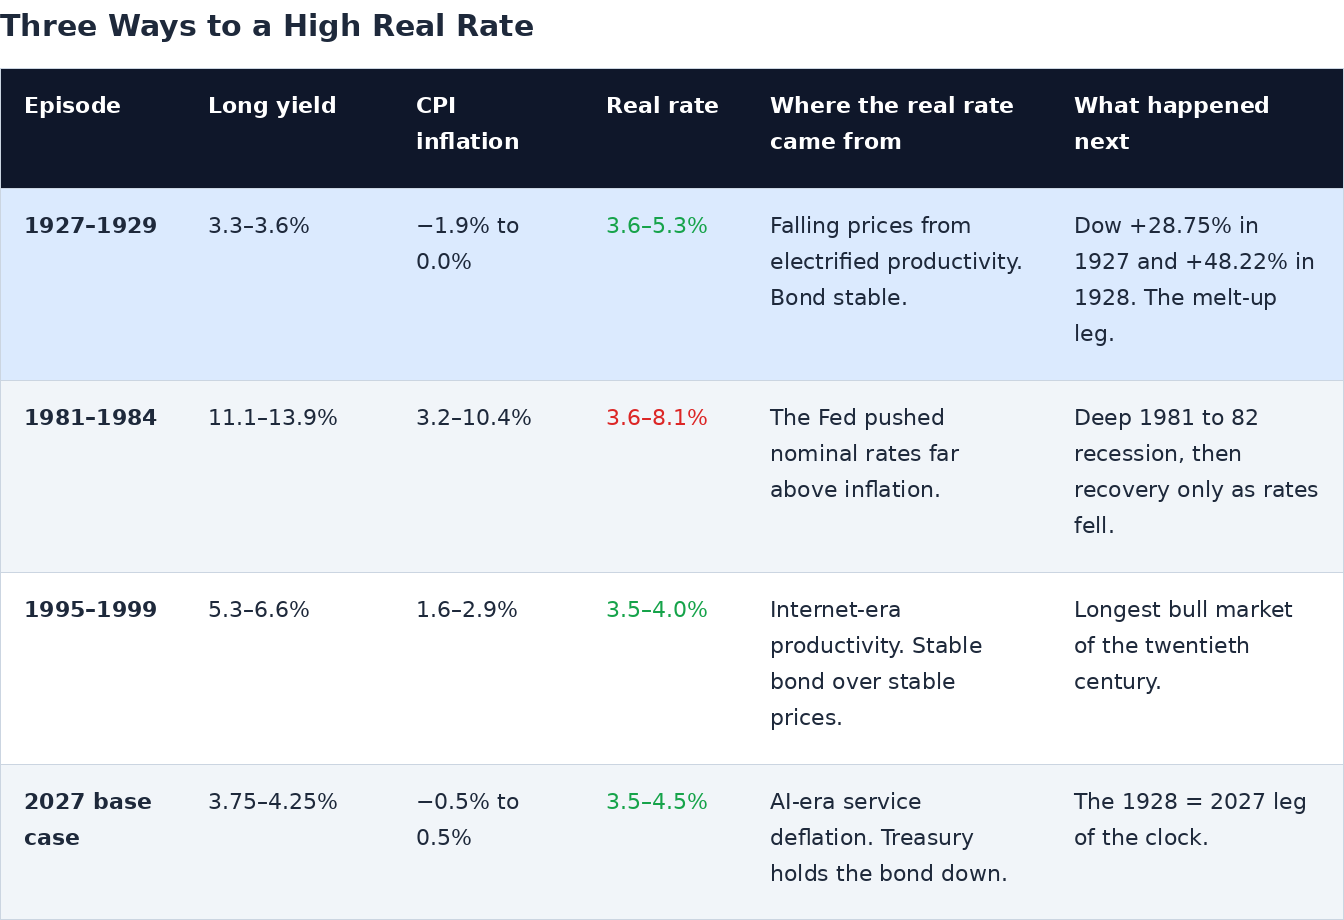
The table makes the point that the level of the real rate says nothing by itself. Early-1980s real rates of 7 to 8% came from a 13% bond forced above 6 to 10% inflation, and they produced the deepest postwar recession to that date. Late-1990s real rates of 3.5 to 4.0% came from a 5.5 to 6.5% bond over 1.5 to 3% inflation during the last productivity boom, and they coincided with the longest bull market of the century. The 1927 to 1929 real rates of 3.6 to 5.3% came from a 3.3% bond over a price level that was falling because the electrified factory had made things cheaper, and they coincided with the 1927 and 1928 melt-up. What matters is the source. When the real rate rises because the price level is falling and the return on capital is rising, it is the best news an investor can receive about the decade ahead.
Why 2027 belongs in the first and third rows, not the second
The shift toward capital is already in the data. Warsh's own Jackson Hole figures make the point: business equipment and intangibles investment growing about 9% over four quarters, its fastest since 2021, with more than half of 2026 capital-spending growth attributable to AI build-out, and token sales at the two leading labs running above $100 billion annualized, up more than 500% in a year. Unit labor costs are rising 1.2% while output per hour rises 2.2% and hours barely move. Income is moving from labor inputs toward capital inputs because capital is where the return is. The labor market confirms it from the other side: knowledge-work output is rising while knowledge-work hiring has stopped, which is the definition of output per hour going up.
If AI is to services what electrification was to the factory, and the evidence so far says it is more productive rather than less, then the equilibrium real rate belongs in the 3 to 5% range and a market that prices it there is pricing strength. A 1% real rate against a 5 to 6% productivity trend is the anomaly. It means the bond market has not yet believed the productivity numbers, or that a war premium in the price level is masking them. The move to 3 to 5% is the correction. It arrives through falling prices, with the nominal 10-year drifting lower rather than higher, so it never becomes the 1981 kind. It raises the return on every dollar of saving without raising the cost of the capital that is producing the boom, because that capital is financed at the long end that Treasury is holding down. And it is the setting in which the 1928 = 2027 leg of the clock, the largest single-year gain in the analog, took place. A real rate in the 3 to 5% range is not the risk to the melt-up. It is the signature of it.
Warsh's bid for Bessent's plan
This is also why the one-and-done hike fits the Colossus Doctrine rather than contradicting it. If the Doctrine is right, Warsh is not tightening into a boom. He is using a single short-rate move to give a strong bid to Bessent's plan. The hike raises the bill rate, and the bill rate is what every stablecoin issuer, money fund and foreign treasurer earns on a dollar that migrates into the front end of the Treasury market. That migration is the funding for the long-bond buybacks. Warsh supplies the demand for bills. Bessent uses it to retire duration and hold the long rate down while the price level falls. The real rate rises to the 1920s band through the productivity channel, the nominal 10-year stays low through the duration channel, and the short rate never needs to go higher than the one move that set the bid in motion. The Fed of 1928 tried to run the same economy with the discount rate alone and had to take it to 5%. The Accord splits the job and stops at 4%.
Oil on the Clock
Crude is the one series on the clock that is currently out of position, and it is also the one the model needs to see move first. Kansas-Oklahoma crude averaged $1.4535 a barrel from May 1921 through December 1930, peaked at $2.25 in December 1921, and spent the second half of 1927 at $1.155 to $1.24, roughly 20% below the May 1921 level and 40 to 45% below the 1926 plateau of $2.05. On the 99-year alignment, 1927 crude indexed to May 1921 averaged 87.7 while 2026 crude indexed to May 2020 has averaged 238.2 through August. Every year on the clock, 2026 has been at least 1.2 times its 1920s analog. The ratio is now 2.7. The two series have a correlation of −0.20 across the aligned window, so it is not a month-to-month fit that is being claimed here. What is being claimed is direction: 1927 was the year crude fell, and 2026 needs to become one.
The path exists. ANZ's base case is a prolonged but calibrated standoff, with Gulf exports constrained through the rest of 2026, gradual reopening in late fourth quarter, and pre-war throughput by late first or early second quarter 2027. Hormuz transits are running about 10 commodity ships a day, the lowest since May. Goldman Sachs' fourth-quarter WTI forecast, even after raising it for a longer disruption, was $67. June 2026 already showed what a partial reopening does: WTI fell from $108.6 to $70.6 in two months, a larger and faster decline than the 1927 Seminole collapse. If the clock is intact, November is when the decline should be visible in month-end prices and the December CPI is when it should be visible in the price level. If crude is still above $90 at Thanksgiving, the model's timing has slipped and the real-rate gap closes later than we expect.
There is no natural-gas analog to run. The 1920s had no benchmark gas price. The EIA wellhead average was 8 to 11 cents per thousand cubic feet across the decade, a by-product price with no market. Henry Hub has averaged $3.54 in 2026 through August and closed August at $2.90. Gas is not part of the real-rate story in either era. Oil is.
Where This Fits in the Colossus Doctrine
The Doctrine describes two engines in each era. The 1920s ran on factory electrification and dollar bankers' acceptances. The 2020s run on shale plus AI and dollar stablecoins. The real-rate finding sits at the junction of the two engines. The productivity engine produces the disinflation that lifts the real rate toward 4 to 5%. The monetary engine produces the price-insensitive bill demand that lets Treasury shorten the sovereign funding mix, retire long bonds, and hold the nominal bond low while the price level falls. The one-and-done hike is the hinge between them. It is the Fed's bid for Treasury's bills, and therefore for Treasury's buybacks. Neither engine on its own gets to the 1927 configuration. Together they get there without a recession, which is the point of the Doctrine and the reason it breaks with the 1928 to 29 script.
That break is deliberate. In 1928 the reserve banks raised the discount rate from 3.5% to 5% between January and July as they tried to restrain speculation, and because prices were falling the real short rate rose faster still. The 1928 Fed had no Treasury partner managing duration and no statutory stablecoin bid. It had a gold standard and a call-loan market, and it tightened into a productivity deflation. The Accord replaces that mechanism. Treasury does the duration work. The Fed makes one demonstration move and then cuts into the deflation rather than hiking into it. The real rate still reaches the 1920s band, but it gets there with a 3.75% funds rate and a falling price level rather than a 5% discount rate and a collapsing one. The one-way valve still operates: foreign carry unwinds and recessionary tightening abroad send capital toward dollar tokens and bills, which is the same rollover bid that funds the buybacks. And the users-over-producers allocation still holds, because a rising real rate produced by falling prices is a transfer to consumers and to the firms that deploy AI, not to the firms that sell compute.
The market, in our view, will reward the one-and-done rather than punish it. A demonstrated reaction function, a lower 10-year, oil rolling over, and the first service-deflation prints will read together as the moment the Accord's logic became visible. That is the genius of the Colossus: a productivity boom financed at a low long rate and disciplined by a short rate the Fed is willing to move once, with the price level doing the work that the Fed of 1928 tried to do with the discount rate.
What Would Prove This Wrong
The Doctrine has always carried its falsifiers with it, and the real-rate thesis adds several of its own.
The Fed does not stop at one. UBS expects hikes in September and December, and markets have priced two by March. A second hike in December with the 10-year still near 5% would mean the Fed is running the 1928 script and the Accord is not operating. That is the single most exposed assumption in this paper.
The 10-year does not fall on the hike. If the long end reads the hike as the start of a cycle, or as confirmation that inflation is embedded, the curve flattens by the short end rising rather than the long end falling. The 10-year has been above Bessent's 4.75% line since early September and touched 4.99% on September 11. Watch the 10-year in the 48 hours after the decision.
Hormuz stays shut into 2027. ANZ's base case already puts full throughput in the second quarter of 2027. If crude is above $90 at the end of November and diesel above $6, the inflation path is delayed and the real rate stays below 2% through the winter. The clock would then be running late, though not necessarily broken.
Service deflation does not appear in the statistics. Service output is hard to measure and the late 1990s productivity boom was recognized only through revisions. The true rate may be 5 to 6% while the published rate lags for years. If core services inflation is still above 3% in the March 2027 CPI, the mechanism is either slower or weaker than we expect.
Treasury does not follow. If Bessent has not announced a substantially larger buyback program within roughly a month of the FOMC decision, the Accord is a one-sided story and the hike is just a hike. The $6 billion operation of September 10 is the floor we expect him to leave behind, not the ceiling.
The stablecoin bid stalls. The buybacks are funded at the front end. A contraction in dollar-token float, whether from a regulatory event, a redemption run or a foreign competitor, removes the rollover bid and forces Treasury back toward long issuance. Float is the Doctrine's principal exit signal, and that has not changed.
The measurement itself. The 1920s bond composite is not a true 10-year and the 1920s CPI carries ±0.3 points of rounding. The month-to-month correlation between the two decades' real rates is −0.08 across the aligned window. The claim is level convergence at clock time, not co-movement. A reader who wants to reject the thesis on the ground that the eras are measured differently has a fair point about any single month and a weak one about a 3-point gap.
Data Appendix
All monthly series used in this paper, the alignment tables, and the oil and gas comparison are provided in the accompanying workbooks. The series are the NBER long-term U.S. government bond yields for 1919 to 1944; the Consumer Price Index for All Urban Consumers, all items, not seasonally adjusted, with the August 2026 release from the BLS; the 10-year Treasury constant maturity, monthly and daily, with the 30-year daily and the 3-month bill; the personal consumption expenditures price index as a comparison series; WTI crude and Henry Hub daily spot; Kansas-Oklahoma monthly average posted crude prices for 1921 to 1930 from the BLS Wholesale Prices bulletins held at FRASER, with Pennsylvania crude for comparison; U.S. crude first-purchase and natural gas wellhead prices from the EIA; and the New York Fed discount rate series from 1914. Policy sources are Warsh's oath of office on May 22, 2026, his Jackson Hole remarks of August 28, 2026, and the FOMC minutes of July 28 and 29, 2026, together with Treasury buyback reporting from Reuters and CNBC across August and September 2026, oil and Hormuz reporting from Reuters and CNBC, stablecoin figures from Crypto Briefing and Federal Reserve analysis, the BLS Productivity and Costs release for the revised second quarter of 2026, and the Federal Reserve, Richmond Fed and San Francisco Fed histories of the 1920s.
JD Unfiltered publishes independent macro research. This report expresses the authors' views as of September 12, 2026, is not investment advice, and may be circulated freely with attribution. Companion reports in this series: The Colossus Doctrine; Volcker Mark II or Colossus Mark I?; The Scissors Labor Market; The Morrow Moment. A plain-English edition of this report is published alongside it.
The authors hold positions in securities mentioned and reserve the right to buy or sell shares at any time without notice.