
The Grand Unified 1921–1929 vs 2020–2028 Thesis


The JD Unfiltered 100%-Above-Model Call, the August 2028 Peak, and the −50% China–Japan Crack
Anchor: May 1921 = May 2020 | Waypoint reached: 1927 = 2026 (+68 months) | Blow-off peak: August 2028 | Crack: September 2028 — Chinese and Japanese, not American | Recovery: 2029
The Call
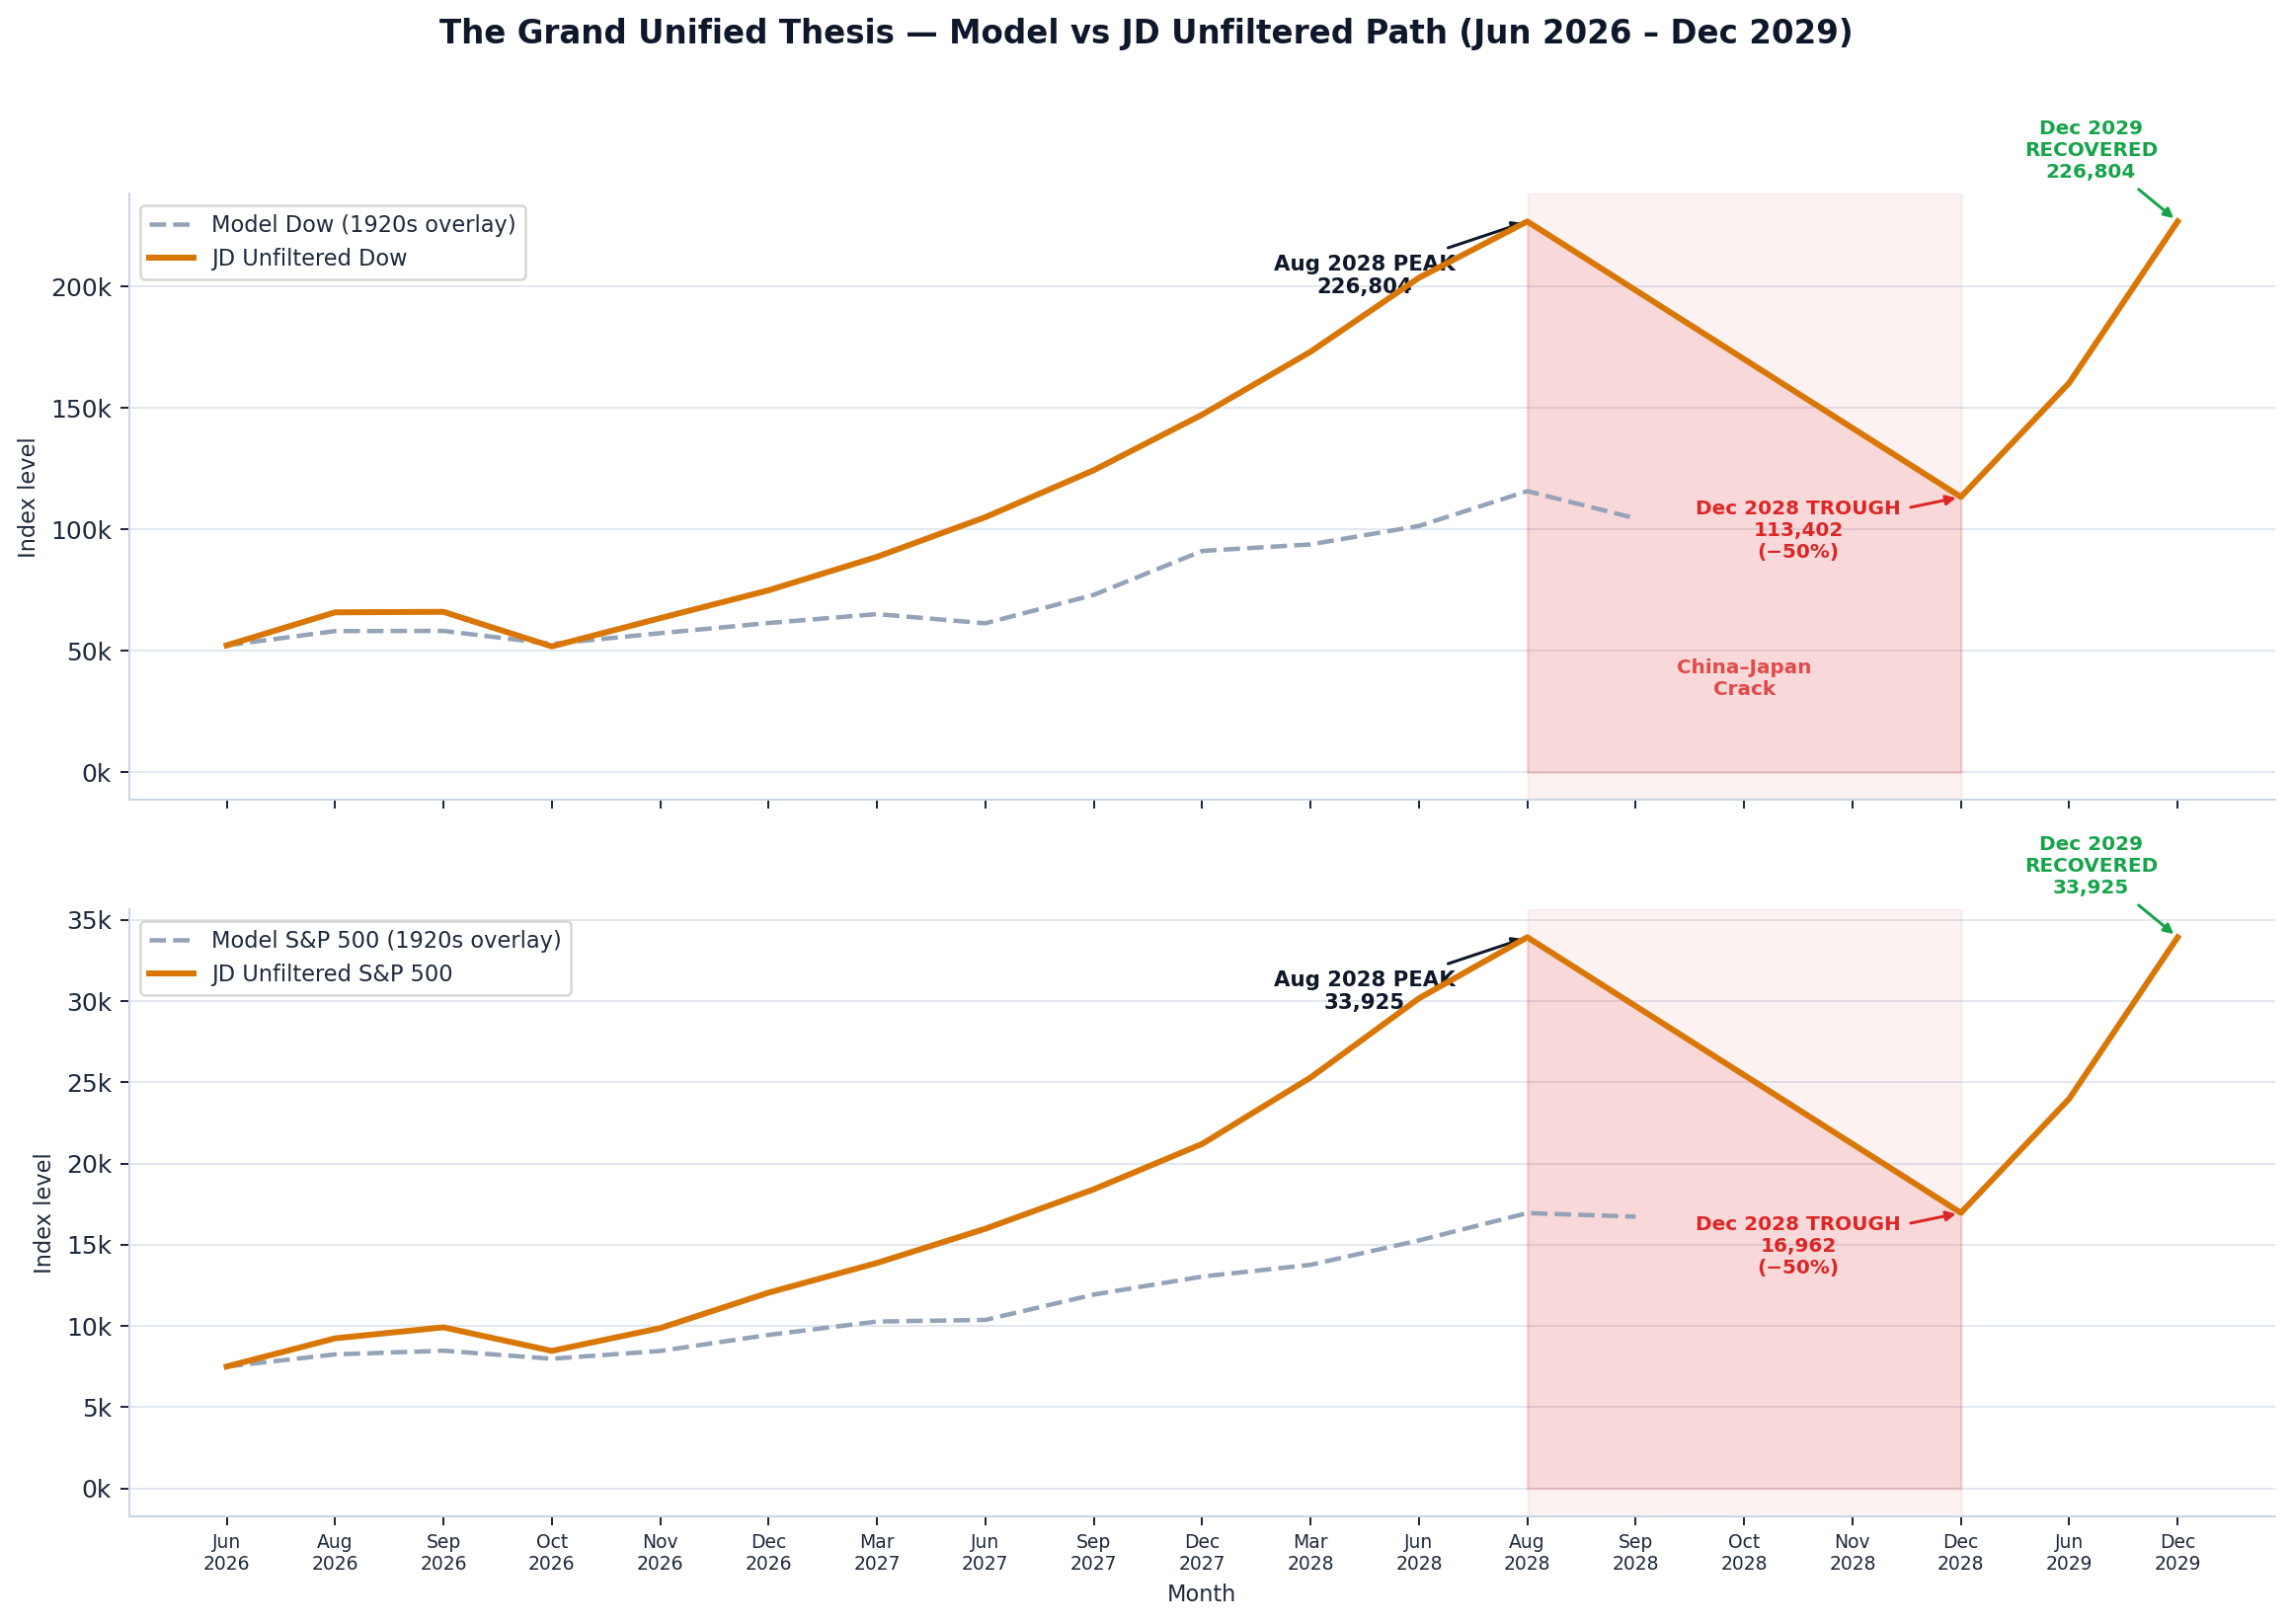
The 1920s overlay says the Dow should finish 2026 up roughly +28% and the S&P 500 up roughly +38%. That is the model. The model is the floor, not the target.
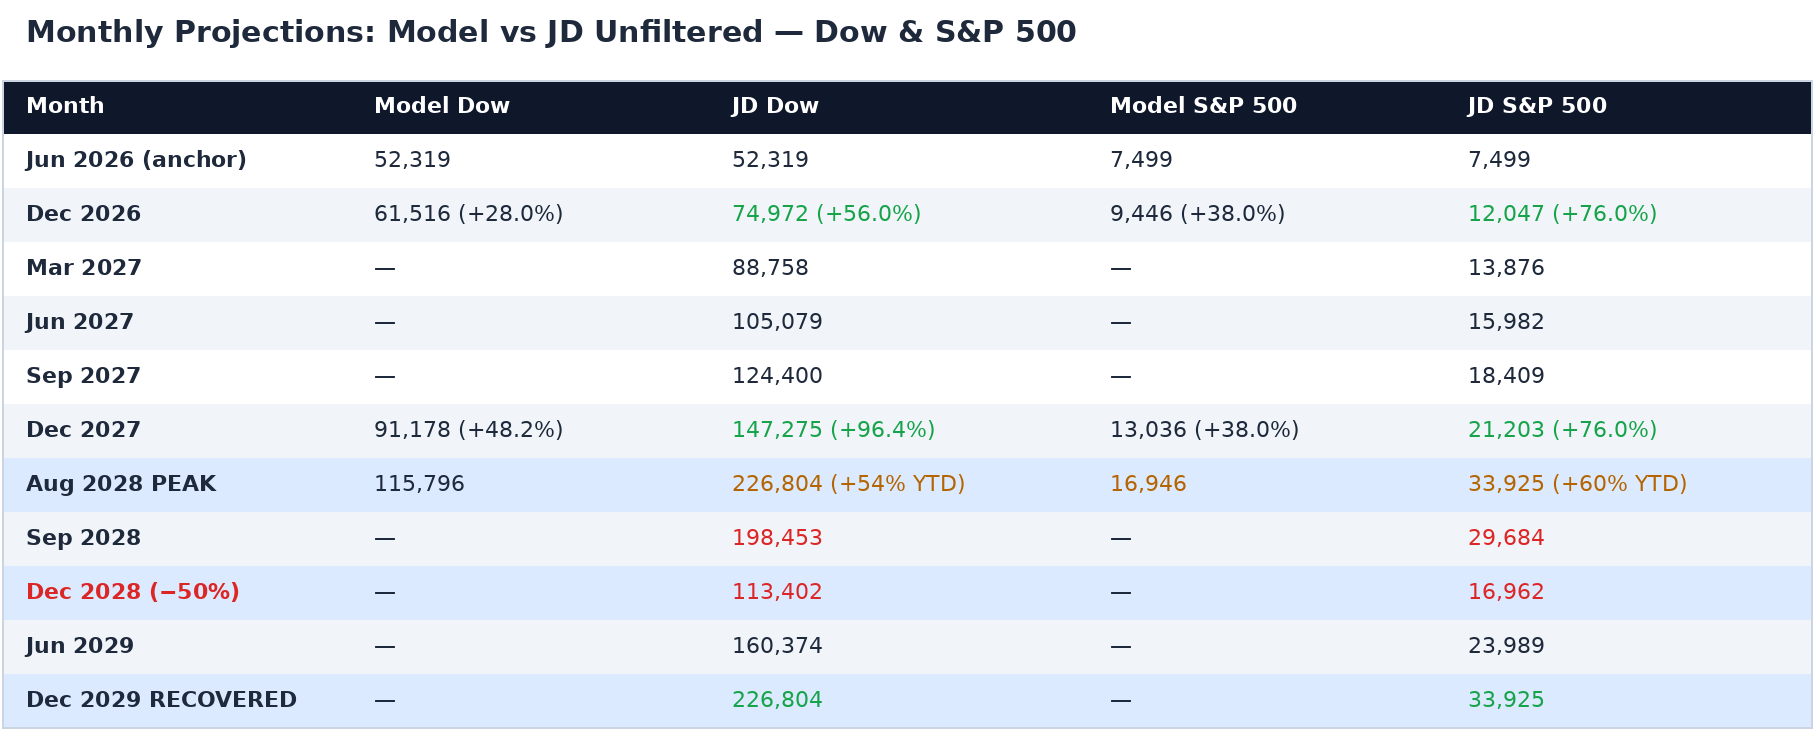
We are calling 100% above the model — every year, every leg — for the entire path from here through the August 2028 blow-off peak. That means Dow +56% and S&P 500 +76% for 2026. Dow +96% and S&P 500 +76% for 2027. And another +54% Dow and +60% S&P 500 from year-end 2027 into the August 2028 blow-off. Peak levels: Dow ~226,800. S&P 500 ~33,900.
Then, over September through December 2028, the market retreats −50% from the August 2028 peak. That is the China-then-Japan crack, not a U.S. crash. The Dow bottoms near 113,400 and the S&P 500 near 16,950 by December 2028 — which puts both indices back exactly on the baseline 1920s overlay track. Then in 2029 the U.S. recovers. By December 2029, both indices are back at or above the August 2028 peak levels. Because we are different this time.
The Proof That It Has Already Started
May 1921 equals May 2020. Both months mark the trough of the deflationary bust that immediately preceded the productivity bull. Both were the buying opportunity of the decade. The DJIA cycle low of August 1921 was 63.90. The DJIA cycle low of March 2020 was 18,591. What happened next, in both cases, was the same.
The +68-month waypoint — January 1927 and January 2026 — is where the thesis either survives or fails. It survives. At that elapsed month, the S&P 90 indexed to May 1921 stood at 201.2. The S&P 500 indexed to May 2020 stood at 203.8. A delta of 1.3% after 5.7 years of compounding, across two independent decades, different indices, different constituents, different anchor prices. That is not a rhyme. That is a reprise.
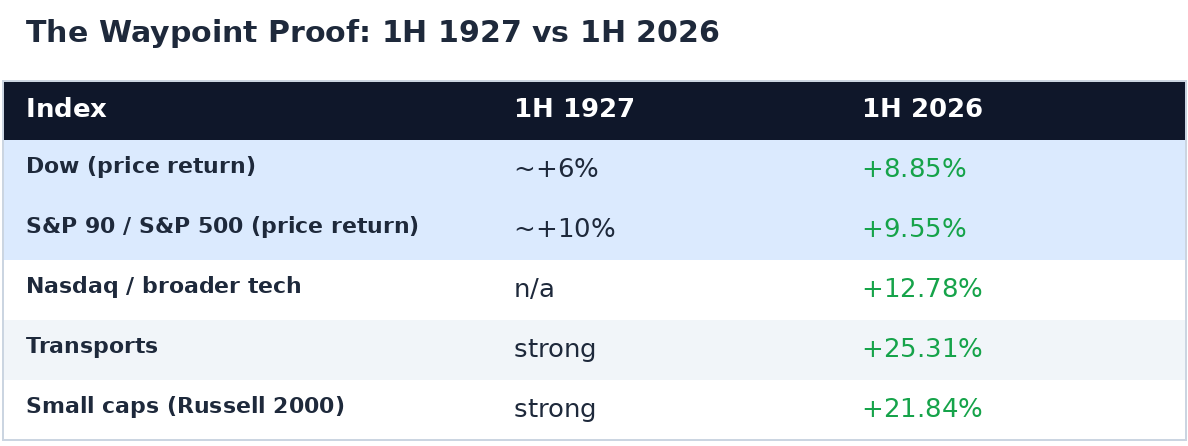
The first half of 2026 continues the tracking with an eerie precision.
Rolling 12-month realized volatility in both eras sat in the 10–20% band throughout the bull. Both decades produced peak rolling 12-month Sharpe ratios of +2.5 to +3.0 during the productivity thrusts, and both dipped to −1 to −1.5 in the air-pocket months — 1922–23, the 2022 tech pullback, the 2025 tariff whipsaw. The full 1921–1929 cycle produced 30.44% annualized total return at 17.30% annualized volatility, Sharpe ~1.83. We are on track to match or exceed that in this cycle.
Why the Model Understates — Six Reasons AI Is Bigger Than Electrification
The 1920s overlay projects the Dow up +28% and the S&P 500 up +38% for 2026. We call 100% above that. Here is why the model, as good as it is, is still a floor.
AI is a general-purpose technology diffusing three to five times faster than electrification. Electricity took roughly fifteen years from Edison's Pearl Street station to broad manufacturing productivity impact. Frontier LLMs went from research paper to enterprise deployment in five to seven years, with workflow diffusion happening in months, not years. The 2020s economy is also dominated by services at 77.6% of GDP — not the manufacturing-heavy 1920s at 30–35% — and services are exactly where AI compounds fastest. White-collar productivity multipliers of two to five times apply to a far larger share of the labor force than electrified factory floors ever reached.
Healthcare productivity is a distinct second boom the 1920s never had. GLP-1 drugs, NLRP3-targeted immunometabolic therapies, precision biomarker stratification, and AI-assisted drug discovery are all compounding simultaneously. This is a productivity vertical that adds to the AI base case, not one that subtracts from it. And capital efficiency is structurally higher: 1920s companies needed physical plant, coal, copper, and steel; 2020s frontier companies need GPUs and electricity, with GPU productivity doubling every twelve to eighteen months while the cost per useful FLOP falls.
Monetary and fiscal transmission is also faster. The Fed can move on-chain; Treasury liquidity is real-time; productivity gains flow into corporate margins within one earnings cycle rather than the two-to-three year lag typical of the 1920s. And the 1H 2026 broad-market tape is already running at late-1927 and early-1928 levels of breadth in the first half of the year — Nasdaq +12.78%, Russell 2000 +21.84%, Transports +25.31%. The market is signaling that it wants to compress the 1927–1928 melt-up into the second half of 2026.
The Melt-Up — 2027 and the Coolidge Analog
The 1928 historical analog says +48.22% for the Dow and +38% for the S&P 90 in what was then the year before the peak. Under our productivity thesis we double those figures: Dow +96%, S&P 500 +76% for 2027.
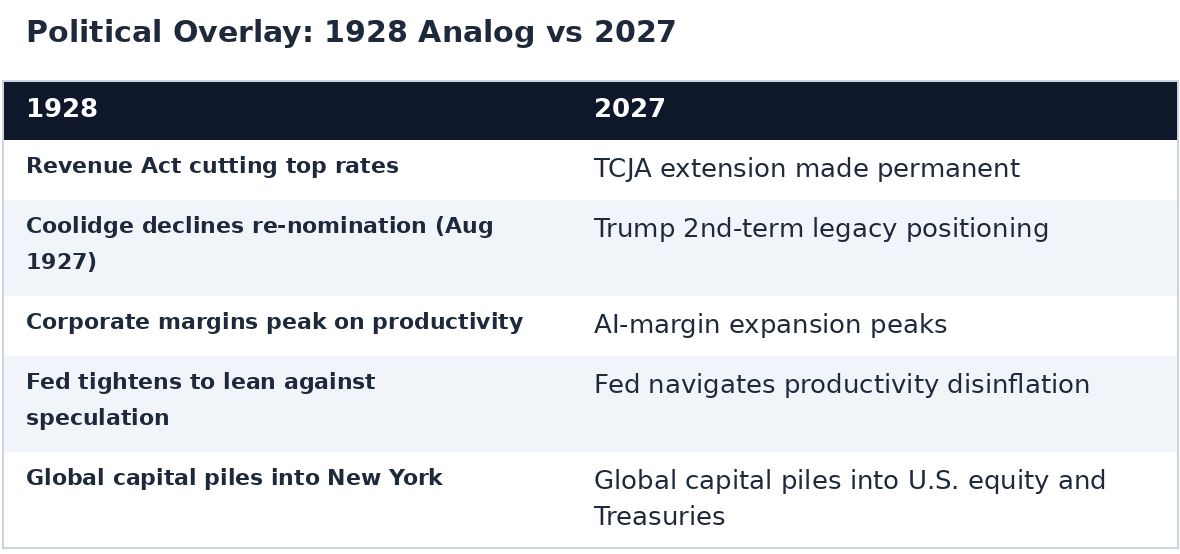
By December 2027, the Dow reaches 147,275 and the S&P 500 reaches 21,203. Sharpe ratios peak. Every major sentiment indicator hits record highs. Every institution is fully invested. Every retail platform runs weekly all-time-high headlines. The setup for the final act is complete.
The Blow-Off Peak — August 2028
From year-end 2027 into August 2028, the market adds another +54% for the Dow and +60% for the S&P 500 in eight months. This is the equivalent of the March-through-September 1929 blow-off, compressed and amplified by algorithmic order flow, options gamma, and passive inflow mechanics that did not exist in 1929. Rolling 12-month realized volatility spikes above 25%. Rolling Sharpe hits +3.0 or higher. Nothing about the tape says stop. The Dow reaches ~226,800. The S&P 500 reaches ~33,900. Then the crack begins on the other side of the Pacific.
The Crack — September to December 2028, Beijing and Tokyo, Not New York
The September 1929 analog month is September 2028. But 1929 was a U.S. event. In 2028, the U.S. is the safe haven, not the epicenter.
China breaks first. Approximately $22 trillion in Chinese bank deposits sits in a system with roughly $10.5 trillion in identified balance-sheet impairments — LGFV debt, real-estate developer defaults, and hidden local-government liabilities. Tokenization and Starlink give Chinese savers exit rails that did not exist in 1929. When confidence cracks, the flow is fast and one-way. The parallel to the 1927 Showa Financial Crisis in Japan is exact: a banking panic in a command-adjacent economy that spread outward. The China 2028 version carries 100 times the deposit base and USD-denominated stablecoin exit valves that function as a digital bank run.
Japan follows for structural reasons of its own. The Bank of Japan balance sheet holds more than 50% of outstanding JGBs. Yen carry trades unwind non-linearly when the JGB curve breaks. Japan's demographic tail — median age 49 — and 260% debt-to-GDP compound the fragility. The 1927 Bank of Taiwan run is the historical anchor; Japan's productivity decade ended in 1929 before the U.S., the same sequence playing forward.
The magnitude of the U.S. retreat is −50% from the August 2028 peak over four months, driven by forced selling from Chinese- and Japanese-domiciled institutional holders raising USD liquidity, yen carry unwind pulling global risk lower, options gamma and CTA de-grossing amplifying the down-day tails, and speculative excess purging — but not structural damage to U.S. margins. This is why it is not deeper. The 1929–1932 crash took the Dow from 381 to 41 (−89%) because of gold-standard rigidity, margin-debt leverage, Fed policy error, Smoot-Hawley, and sequential bank runs. 2028 has none of these. The Fed has full policy flexibility. The dollar is the reserve. FDIC and Fed liquidity facilities backstop the banking system in hours, not years. The drawdown is severe but bounded.
By December 2028, the JD Unfiltered trough lands the Dow near 113,400 and the S&P 500 near 16,950 — exactly back on the baseline 1920s overlay track. The −50% retreat unwinds precisely the excess built above the model between mid-2026 and August 2028.
The Recovery — Because We Are Different Now
From December 2028 through December 2029, the U.S. recovers back to the August 2028 peak. Dow ~226,800. S&P 500 ~33,900 or higher.
In 1929, the U.S. was on gold. In 2028, the U.S. is gold. Capital flight from China and Japan lands in Treasuries and U.S. equity — there is nowhere else for it to go. The Fed can and will move on-chain within hours of the peak, deploying balance sheet expansion, standing repo facilities, and direct discount-window support before the second down-week. U.S. fiscal capacity is unmatched: $2 trillion of Treasuries can be issued in ninety days without stress. Post-2008 Basel III and Dodd-Frank leverage limits mean the banking system enters 2028 far less levered than in 1929. And AI and healthcare do not stop compounding because Chinese banks fail. Corporate margins keep expanding. The earnings base under the tape is real. The crack purges price excess, not fundamentals.
China and Japan absorb the 1930–1932 scenario. The productivity boom continues in the U.S. because the productivity boom was never in China or Japan to begin with. December 2028 is the buying opportunity of the decade, echoing March 2020 and August 1921. Twelve months later, both indices are back at the August 2028 peak.
The Full Projection
What We Told You — What We Are Telling You
We told you in June 2026 that the 2020s would rhyme with the 1920s. At the +68-month waypoint, the S&P 500 is 1.3% off the S&P 90 track. We are now telling you the 1920s model is our floor, not our path. We call 100% above the model at every leg through August 2028.
We are also telling you the peak breaks in September 2028 — not in New York, but in Beijing and Tokyo. The tape retreats −50% over four months and lands the market exactly back on the baseline 1920s overlay. Then we recover. Because the reserve currency, the fiscal capacity, and the productivity base all sit in the U.S. this time.
The 1920s overlay is the map. The terrain is steeper up, steeper down at the peak, and — this is the part that matters — faster to recover, because there is nowhere else for global capital to go.
The peak is August 2028. The crack is China and Japan. The recovery is us.
Disclosure: The authors hold positions in securities mentioned and reserve the right to buy or sell shares at any time without notice. All price targets, index projections, return estimates, and the historical analog framework are illustrative models and forward-looking opinions based on the authors' thesis, not facts or guarantees. They rest on assumptions that may prove materially incorrect. Forward-looking statements involve significant risks — including AI adoption rates, geopolitical developments, monetary policy, regulatory changes, and macroeconomic conditions — and actual results may differ materially. Historical returns do not predict future results. Sources: Wikipedia DJIA annual returns table; Slickcharts S&P 500 returns; Guggenheim Investments Dow Historical Trends; FRED DJIA monthly series; Undervalued Japan — Showa Financial Crisis 1927. This document is for informational and educational purposes only and does not constitute investment advice. Readers must conduct their own due diligence and consult a licensed financial, tax, and legal advisor before investing.