
The 1920s Redux


How the AI-Stablecoin Boom Repeats 1927–1929, and Why the Real Economy, Not the Compute Makers, Will Own the Melt-Up
Executive Summary
The market of 2026 is repeating the market of 1927, not as metaphor but as mechanism. A century ago, two inventions, the vacuum tube and the thermal cracking of gasoline, ignited a capital-spending renaissance that peaked in 1926, a profitability boom that ran to 1929, and a stock-market melt-up from mid-1927 to September 3, 1929 that was fueled by money the Federal Reserve did not control and could not sterilize. Today, two technologies, artificial intelligence (2022) and dollar tokenization via stablecoins, are running the same script on a compressed clock. The capital-spending crest is 2026 to 2027. The profitability boom carries equities from August 2026 to roughly September 2028. The fuel is tokenized-dollar inflows that sit outside the Fed's perimeter, and this time even the Fed cannot sterilize them.
Our conclusions are four.
First, the melt-up window is open. August 2026 through September 2028 maps to mid-1927 through September 3, 1929. We expect the market to be up approximately 2.5x from current levels, with the S&P 500 at 7,753.77 as of August 10, 2026, implying roughly 19,400 by September 2028. The bare 1927 to 1929 price analog alone hands you 2.07x, or roughly 16,100, before the productivity overlay.
Second, own the users of the technology, not the producers of it. The Dow Jones Industrials, the Dow Transports, the Russell 2000, and the real-economy stocks of the S&P 500 will roar. The compute makers, meaning chip, server, and AI-hardware producers, will match the market for roughly one year from here and then actually decline, even as the index rises, exactly as radio-set makers deflated after 1927 while the users of the vacuum tube minted fortunes.
Third, the integrated hyperscalers will outperform slightly. They sit on both sides of the trade, producing compute and consuming it, but real-world companies will lead.
Fourth, the end does not begin in the United States. The break starts with banking crises in China and Japan, and partially Europe, as tokenized-dollar deposit flight guts their funding bases. The US peak and sharp break follow around September 2028, with a roughly 50 percent decline and a V-shaped American recovery by late 2029, cushioned by the same unsterilizable dollar inflows that powered the boom.
The Stimulating Causes, the Vacuum Tube and Cracked Gasoline
Every durable boom traces to a specific ignition. The 1920s had two.
The vacuum tube was not merely a radio component. It was the ignition of the entire electronics economy, covering long-distance telephony with transcontinental service in 1915, broadcast radio with KDKA in 1920, and ultimately synchronized-sound film. Radio equipment sales grew from roughly $60 million in 1922 to $843 million by 1929, a fourteen-fold expansion in seven years. Critically, the capital formation happened on the receiving end. Investment in receivers ran roughly forty times investment in transmitters. The towers were cheap; the boom was in the millions of endpoints.
Thermal cracking, meaning the Burton process scaled through the early 1920s, doubled the gasoline yield per barrel of crude and acted as a standing fuel subsidy beneath the automobile-and-road complex. By 1929, cracked gasoline supplied roughly a third of the 441.8 million barrels consumed. Vehicle registrations ran from 9.2 million in 1921 to 23.1 million in 1929, and highway construction spending grew from $991 million in 1923 to $2.1 billion in 1927, more than half of all public construction, funded substantially by gasoline taxes the cracking process made cheap enough to bear.
These two inventions were the stimulating causes of the 1920s capex boom, the industrial renaissance, and the profitability boom that followed. Everything else, including the consumer-credit revolution, the electrification wave, and the construction boom, rode on their rails.
Capex Peaks First; the Market Gets Paid Later
The sequence matters more than the levels. Total US investment peaked in 1926 at roughly $16 billion, and then plateaued and eased. The stock market did not care. Profits, productivity, and equity prices ran for three more years, because the payoff phase of a general-purpose technology begins precisely when the spending crest passes and the installed base starts earning.
The modern sequence is the same, compressed. Hyperscaler capital spending ran from $256 billion in 2024 to roughly $443 billion in 2025, with 2026 guidance above $700 billion, a 77 percent step. Global AI investment is forecast to exceed $1 trillion in 2026. This is the 1926 moment. The capex crest is 2026 to 2027, and the profitability boom that pays for it runs through 2028, carried not by the builders of the infrastructure but by its users.
The Clock, 99 Years, Compressed at the Core
The JD Unfiltered analog runs on a 99-year offset: 1921 equals 2020, 1927 equals 2026, 1928 equals 2027, 1929 equals 2028. The AI cycle did not lag the radio clock. It compressed it. AI's commercial ignition in late 2022 reached its capex crest in four years; radio took six. The compression shows up in adoption speed, in deployment scale, and above all in the price collapse of the core input, which Part VI takes up.
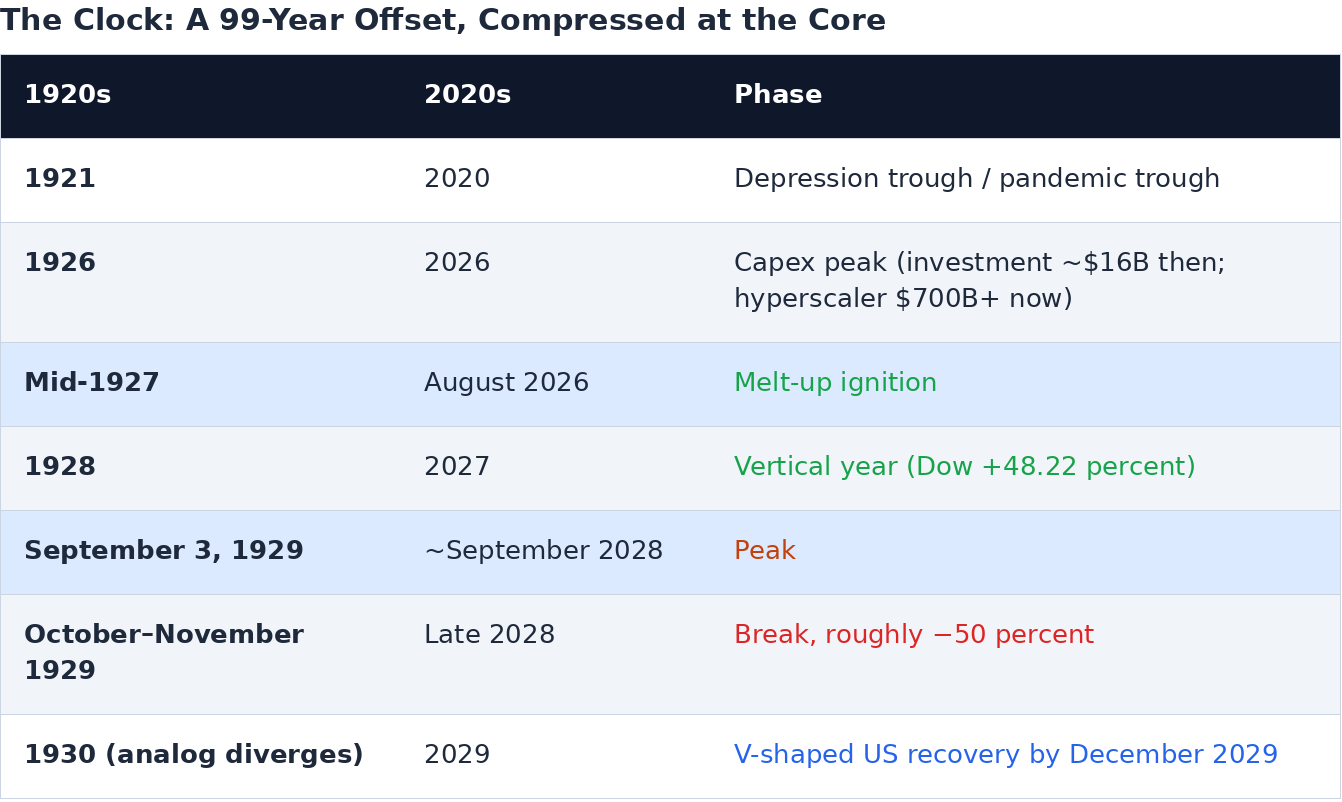
The calendar mapping that matters for allocation.
The recovery divergence is deliberate. 1930 became a depression because the Fed sterilized gold inflows and let the money supply implode. The 2029 analog inverts, because the inflow channel this time cannot be sterilized at all.
The Fuel, Money the Fed Does Not Control
1928 to 1929: Loans by Others
The final two years of the 1920s melt-up were not powered by Federal Reserve accommodation. They were powered by the call-loan market, and specifically by lenders outside the banking system. When the Fed hiked from 3.5 percent to 6 percent in 1928 and 1929 to choke off speculation, member banks retreated from call lending, and corporations, foreign accounts, and wealthy individuals replaced them at call rates of 12 to 20 percent. Loans by others grew to exceed loans by the New York banks. The Federal Reserve's own historians concede the tightening failed because the marginal credit came from outside the system. Call loans peaked near $8.5 billion. Every rate hike made the carry more attractive and pulled in more outside money. Tightening fed the melt-up.
On that fuel, the Dow ran from a monthly average of 183.85 in August 1927 through 202.40 at end-1927, up 28.75 percent for the year, and 300.00 at end-1928, up 48.22 percent, to the peak of 381.17 on September 3, 1929. That run included a final 20 percent sprint from June to September 1929 as the outside-money flow hit its maximum.
2026 to 2028: Tokenized Dollars
The modern loans by others is the tokenized dollar. Stablecoins, at roughly $320 billion outstanding, about 99 percent dollar-denominated, growing 34 to 49 percent year over year, are money formation at private issuers outside the Fed's perimeter. The GENIUS Act requires 1:1 reserves in Treasury bills of 93 days or less, which hard-wires every dollar of stablecoin growth into the front end of the curve. Tether alone holds roughly $141 billion of Treasury exposure, making it a top-20 holder at sovereign scale.
The perverse loop is identical to 1929. Then, higher call rates attracted more outside lending. Now, higher US rates widen the seigniorage and yield gap, pulling deposits out of Chinese, Japanese, and European banks into dollar tokens, whose reserves flow straight back into T-bills. The BIS finds a $3.5 billion stablecoin inflow compresses three-month bill yields by 2 to 4 basis points. Galaxy scenarios run from $162 billion to $3.5 trillion of incremental bill demand, and Citi's base case has the float at $1.9 trillion by 2030. The more the periphery bleeds deposits, the easier US financial conditions get. Tightening feeds the melt-up.
Why Even the Fed Cannot Sterilize
In 1927 through 1929 the Fed at least owned the policy rate that outside lenders were arbitraging. Today it has less than that, for three structural reasons.
The money is created outside the system. Stablecoin issuance is deposit flight from foreign banks into US bills, intermediated by private issuers. There is no reserve-requirement lever, no discount-window lever, and no macroprudential lever that reaches it.
The rate weapon is inverted. Hiking widens the yield gap that drives the inflows. The Fed's anti-speculation tool is the speculation's fuel pump.
And the Treasury wants the bid. With bill issuance at historic scale, the Treasury Borrowing Advisory Committee has explicitly studied stablecoin demand as a financing channel, and Brookings finds redemption outflows hit yields two to three times harder than inflows help them, meaning the official sector's incentive is to protect the float rather than shrink it. The Fed can backstop a redemption-wave bill fire sale in the 2020 style. It cannot lean against the inflow without breaking its own Treasury market.
This is the amplifier. From mid-1929 to September 1929, the last leg of the melt-up ran on maximum outside-money flow. That condition is in force now, and it strengthens mechanically as the foreign deposit flight accelerates.
The Break Comes from the Periphery, Not the US
The 1920s peak was not made in America either. The periphery cracked first. Germany's economy rolled over in 1928 as American call-loan yields pulled capital home from foreign lending, and the Creditanstalt failure in Vienna in 1931 detonated the European banking system. The center was the last to fall.
The 2020s version inverts the direction of flow but keeps the structure. Tokenized-dollar deposit flight is the modern gold drain, running out of Chinese, Japanese, and partially European banks, front-loaded, at internet speed, and rate-insensitive. Their banking systems lose the deposit base that funds their asset side, and credit contracts at home while the flight capital inflates US assets. The sequence runs China and Japan banking crises first, European stress alongside, then the US peak and sharp break around September 2028, with the American market the last and highest to fall, exactly as in 1929. And then the divergence. Because the dollar inflows persist through the crisis, with flight to quality accelerating them, the US recovery is V-shaped into late 2029 rather than a 1930s liquidation. This time even the Fed cannot sterilize, on the way up or on the way down.
Own the Users, Not the Producers
The 1927 to 1929 Evidence
The vacuum tube's producers were crushed while its users minted fortunes, and this happened during the boom, not after it.
Producers deflated from 1927. Radio set sales fell in 1927, from roughly $506 million to $426 million. Average set prices dropped from about $136 in 1929 toward $103 in 1930, and more than half of broadcast stations died. RCA's 1928 moonshot, up more than 400 percent in a single year, was the producers' last speculative act rather than a durable earnings story. The hardware was commoditizing beneath the stock. Cracking did the same to refining, where overcapacity compressed refiner margins even as the auto-and-road complex the cheap fuel enabled kept booming.
Users exploded. Warner Bros, a user of the vacuum tube by way of sound film, ran from roughly $9 to $132 a share as profits went from about $2 million to $14 million between fiscal 1927–28 and 1928–29. Paramount added roughly $7 million of profit, Fox $3.5 million, and MGM $3 million. "Lights of New York" cost $23,000 and grossed $1.2 million. That is what happens when the core input's price collapses: the application layer captures the surplus.
And the broad market told the same story. The 1928 to 1929 leadership was not radio manufacturers. It was the industrial economy that the cheap electron and the cheap gallon made more profitable, meaning utilities, motors, steel, retail, and the railroads that carried the freight of a booming physical economy. Dow Theory demanded the Transports confirm the Industrials for a reason. The boom was real-economy-wide.
The 2026 to 2028 Version: Compute Prices Head Toward Zero
The core input of this cycle is deflating faster than any input in industrial history. Inference costs have fallen roughly 1,000x in three years, from $60 per million tokens in 2021 to $0.06 in 2024, and are now halving roughly every two months through 2026. GB300-class systems price tokens near $0.12 per million, 35x below the Hopper generation, with GPT-4-equivalent output projected below $0.01 per million by 2028, cheaper than a database query. Researchers document a structural break in May 2024, when pricing shifted from technology-driven to competition-driven, with roughly 600x total decline, and most providers now price API access below cost.
Meanwhile the producers carry capex intensity near 34 percent of revenue, against a roughly 15 percent peak in the 1990s telecom build, and investor scrutiny is already rotating from the producers' spending to the users' cash-flow visibility. Add the stablecoin rails compressing payment and treasury costs across more than 140 Fortune 500 deployments, with B2B stablecoin payments up 733 percent year over year, and the productivity dividend of AI plus tokenized money diffuses through the entire economy, exactly as electricity, the vacuum tube, and cracked gasoline diffused after the 1926 capex peak.
As compute pricing heads toward an infinitesimally small number, the profit boom belongs to the users of that productivity. The producers of compute are the radio-set makers of 1930 in formation.
The Allocation, What Roars, What Stalls, What Falls
The Dow Jones Industrials, the Dow Transports, the Russell 2000, and the real-economy stocks of the S&P 500 will roar. These are the Warner Bros of this cycle: industrials, financials, healthcare, retailers, logistics, and services companies whose cost curves are being repriced by near-free intelligence and near-free dollar rails. The Transports matter for the same reason they mattered in 1928. They are the confirmation index of a physical-economy boom, and a melt-up that the Transports confirm is the analog running on schedule. The Russell 2000 is the highest-torque expression, because small companies convert a collapsing input cost into margin faster than anyone, given that intelligence was previously their scarcest and most unaffordable input.
The compute makers, meaning chipmakers and AI-server and hardware producers, will match the market for roughly one year from here, and then actually decline. Their RCA-1928 moment is behind or upon them. From here, momentum and index flows hold them at market performance through roughly mid-2027, and then the arithmetic of 34 percent capex intensity, below-cost token pricing, and a customer base that has finished its crest-phase buildout turns them into the deflating producers of 1928 to 1930, falling in absolute terms even as the index melts up. Radio set revenue fell in 1927, two full years before the market peaked. The same divergence starts here.
The integrated hyperscalers will outperform slightly. They sit on both sides of the trade, producing compute and consuming it at scale in their own applications, so the deflation of the input partially self-hedges. But slightly is the operative word. Their capex intensity caps the multiple, and they will not lead.
Real-world companies will lead. That is the whole lesson of 1927 to 1929, and it is the position of this report.
The Target, Up 2.5x from Here
The S&P 500 stands at 7,753.77 as of August 10, 2026. The bare price analog, running the Dow's August 1927 average of 183.85 to the September 3, 1929 peak of 381.17, is 2.07x, which maps to roughly 16,100. Starting the analog at January 1927, near 155, delivers 2.46x. The JD Unfiltered model has never been a bare price transplant. It carries the 2x-productivity overlay, meaning up 56 percent for 2026 against 1927's 28.75 percent, and up 96 percent for 2027 against 1928's 48.22 percent, justified by three amplifiers the 1920s never had at this scale.
The first is a larger, faster outside-money channel. Call loans peaked near $8.5 billion, while the stablecoin float is roughly $320 billion growing 34 to 49 percent annually toward a $1.9 trillion base case, and it strengthens with every basis point of foreign banking stress.
The second is a steeper input-price collapse. The vacuum tube never deflated 1,000x in three years. Compute has, and it is still halving every two months.
The third is a front-loaded flight bid. The periphery crisis that ends the run first accelerates it, as Chinese, Japanese, and European deposit flight lands in US assets on the way to the peak.
On that basis, the target is approximately 19,400 on the S&P 500 by roughly September 2028, up 2.5x from here. The 2.07x bare analog, near 16,100, is the floor the tape hands you. The productivity overlay and the tokenization flywheel close the gap to 2.5x.
The Exit Signal and the Endgame
The same fuel gauge that powers the melt-up is the exit signal. In October 1929, loans by others peaked and reversed, and the market followed within weeks. The modern equivalent is stablecoin float growth. The month the float stalls or reverses, whether from a periphery banking seizure going systemic, a redemption wave, or a regulatory strike at the rails, the August 2026 to September 2028 window is closing, whatever the calendar says.
The endgame script runs as follows. China and Japan banking crises break first, with European stress alongside. The US market peaks around September 2028 as the last and highest. A roughly 50 percent decline follows into late 2028. And the US recovers in a V by December 2029, because the unsterilizable dollar inflows that fueled the boom persist through the bust as flight capital, which is the cushion the 1930 Fed refused to allow.
Watch the float. Own the users. The real economy leads.
Sources
Historical figures are sourced inline to the EH.net Encyclopedia; the Journal of Information Policy; Princeton on Burton and the oil industry; the NBER, including Eugene White; Federal Reserve History; FRED; and contemporary accounts of the 1929 crash and the rise of sound film via the Library of Congress and the Los Angeles Times. Modern figures draw on CreditSights and Analysis Atlas for hyperscaler capex; Goldman Sachs for global AI investment; Reap and Datawallet for stablecoin statistics; the text of S.394; Tether's quarterly disclosure; BIS Working Paper 1270; Galaxy Research; the Treasury Borrowing Advisory Committee; Brookings; a16z's LLMflation work via ValueAdd VC; the Stanford AI Index via Yano AI; GPUnex; arXiv; O-Mega; Allianz Research; and Stablecoin Insider.
A JD Unfiltered Market Analog Report. This document presents a historical-analog market thesis for discussion purposes and is not investment advice. Market data as of August 10, 2026; S&P 500 level sourced from real-time index quotes. Historical figures sourced inline. The authors hold positions in securities mentioned and reserve the right to buy or sell shares at any time without notice.