
Japan's Deposit Exodus


Disintermediation into USDC, Ripple USD, and Gold Tokens Is Draining Deposits, Forcing Yen Decline, and Cracking the Nikkei — The Correction Has Already Begun
Strategic Analysis · Data through 29 July 2026
URGENT WARNING — SOMETHING IS ABOUT TO GIVE. The Nikkei has already entered a technical correction, down more than 10% from its June all-time high, shedding ¥82 trillion in three weeks and plunging roughly 4% on July 28 to a two-month low. The market blames semiconductors and AI multiples. That is a misdiagnosis. The deeper force is disintermediation: Japanese depositors pulling cash out of zero-yield yen banks into USD stablecoins and tokenized gold. Total bank deposits are now falling month-over-month. The BOJ is buying fewer of its own bonds as it accelerates its taper. Loan growth has hit a post-COVID record of 6.3% while deposits shrink. A shrinking deposit base, a retreating central-bank buyer, and a record bond-supply pipeline together point to a massive bond- and stock-market correction now underway. Something is going to give.
Part I — Deposits Are Now Falling
The migration has crossed from decelerating inflows to outright outflows. Total Japanese bank deposits fell to $8,640.6 billion in May 2026 from $8,783.2 billion in April, an absolute month-over-month decline. Bank lending rose 6.3% year-over-year in June, the fastest pace since August 2020, while deposit growth stalled near 1.8%.
This is the single most important change since the prior report. The deposit base is no longer merely growing slowly; it is contracting in nominal terms. The loan-to-deposit gap is widening at a record pace, and banks are now structurally short of funding for the first time in the modern era.
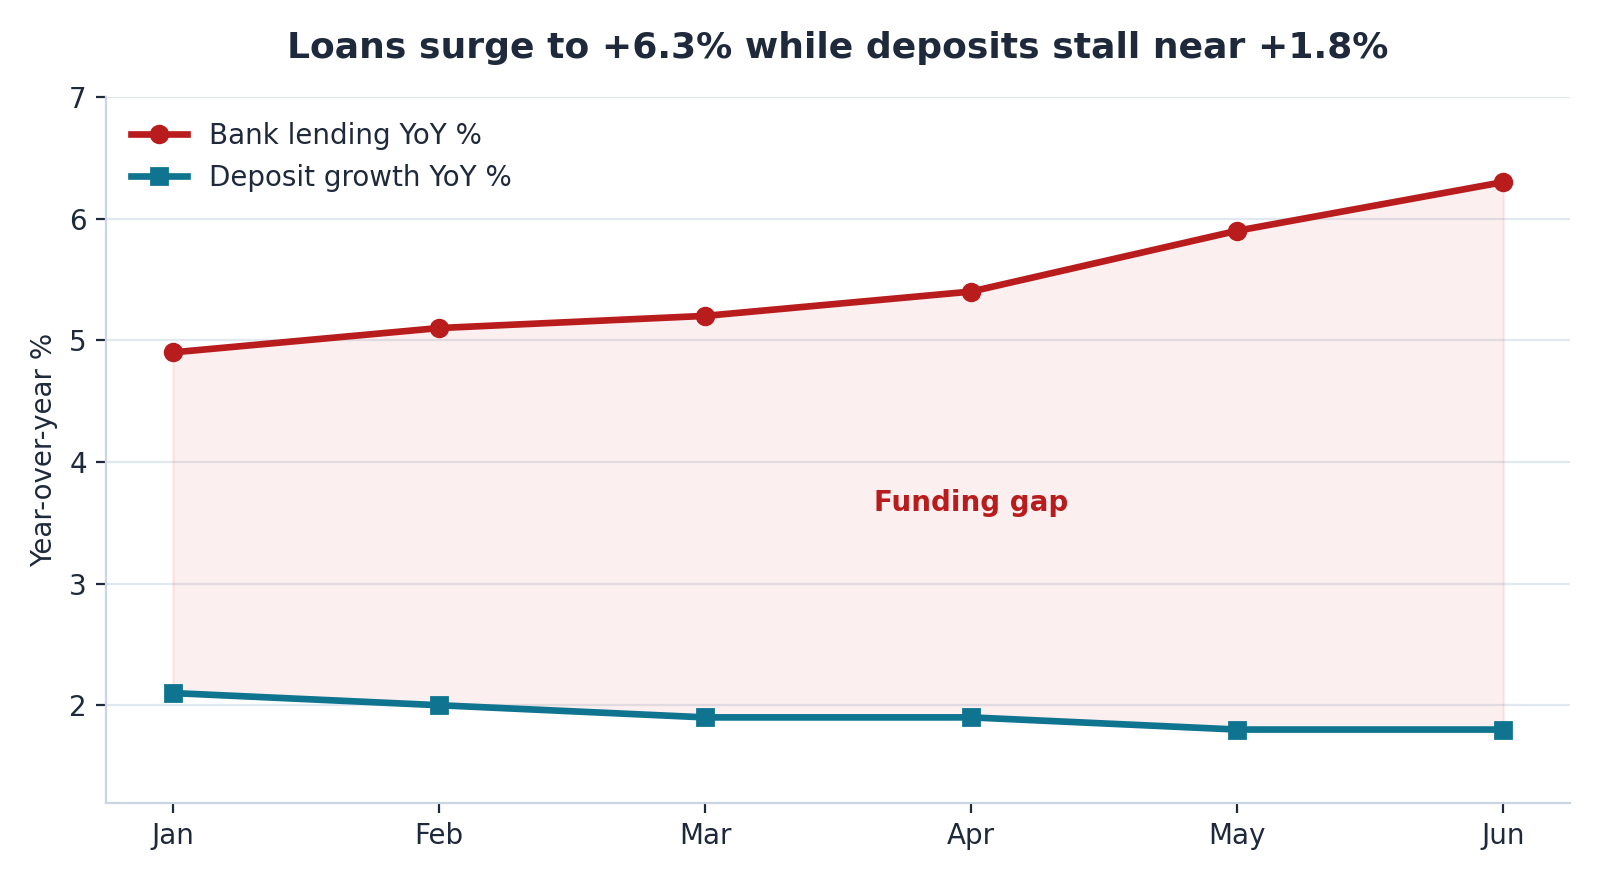
Bank lending vs. deposit growth, year-over-year. Source: Bank of Japan.
Part II — Three USD Stablecoins Now Live
The USD stablecoin rollout has vastly outpaced expectations. As of July 2026, three dollar and stable instruments are live in Japan, all distributed through SBI: USDC from Circle, Ripple USD, which launched June 24, and JPYSC, SBI's own yen trust-type stablecoin. SBI is also acquiring the exchange bitbank for roughly $289 million, a deal closing in October 2026 that dramatically expands distribution rails.
USDC lending via SBI VC Trade pays 5% to 10% against 0.33% on yen deposits. With three funds now competing for savers' capital behind a megabank-scale distributor, the disintermediation channel is wider, deeper, and faster than the base case assumed. Japanese household crypto allocation is still just 0.56% against 3.95% in the United States, which means the runway remains enormous.
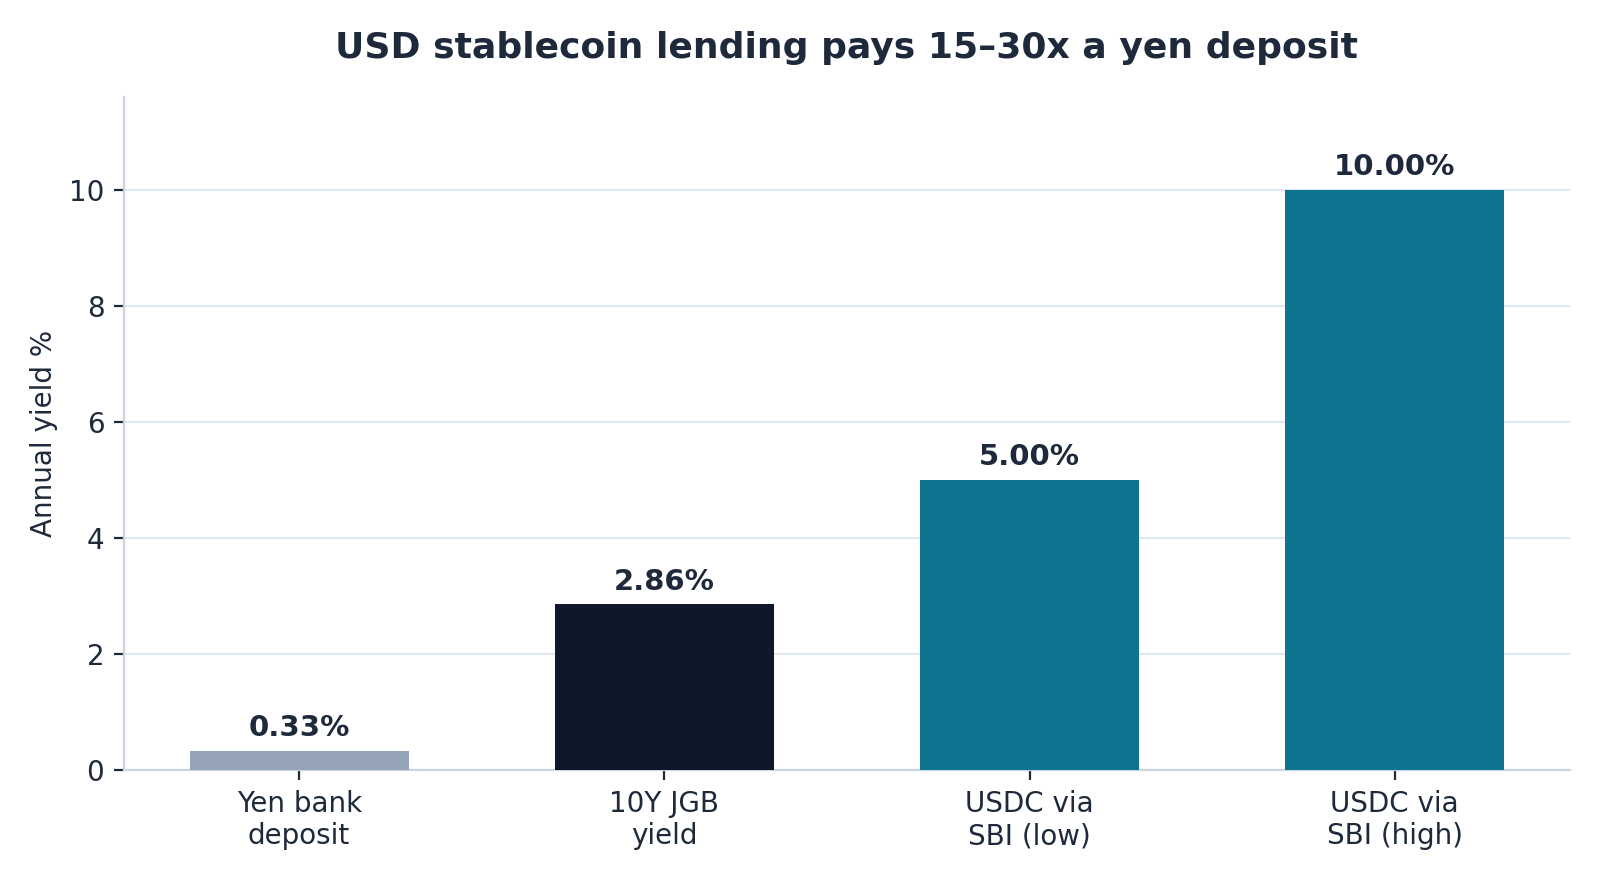
Annualized yields: yen deposit vs. JGB vs. USDC lending. Source: SBI VC Trade, BOJ.
Part III — The BOJ Retreats as Yields Climb
As deposits drain, the BOJ is accelerating its JGB taper to ¥400 billion per quarter from July 2026, removing the largest buyer of government bonds exactly as supply pressure peaks. The 10-year JGB yield has climbed to roughly 2.75% to 2.86%, up 21.9% over six months, marching toward the 3.5% systemic-crisis trigger.
Japan must refinance approximately ¥120 trillion to ¥150 trillion of maturing debt annually against ¥1,185 trillion outstanding. At a steady-state 4% yield, debt service consumes over 40% of all tax revenue. With domestic deposits shrinking and the central bank withdrawing, the marginal buyer of JGBs is vanishing. This is the bond-market squeeze that forces yields violently higher.
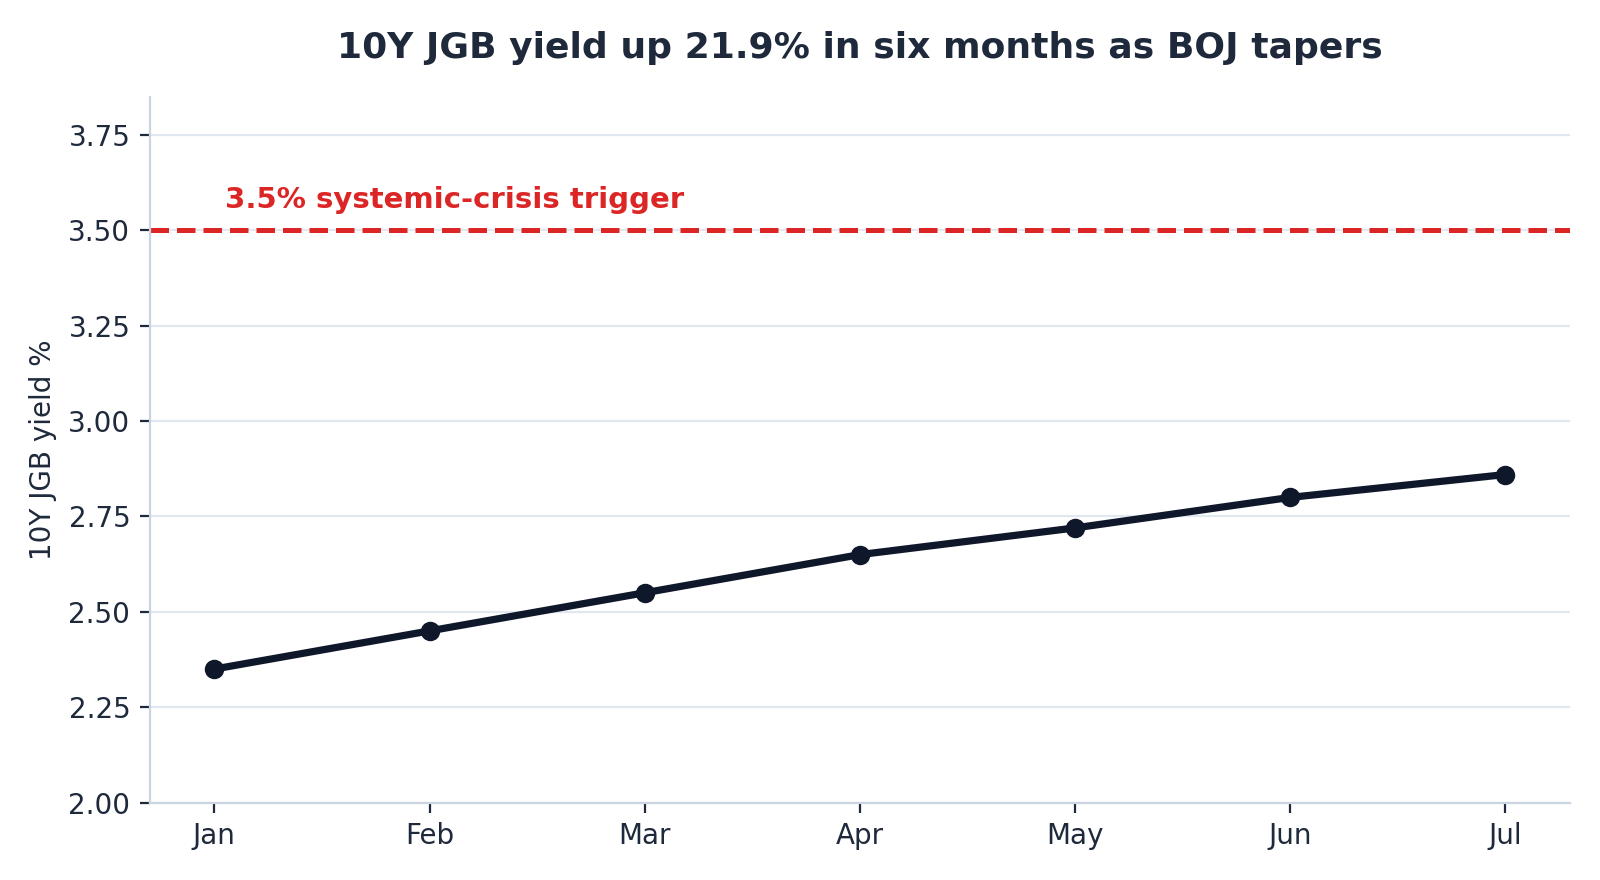
10-year JGB yield trajectory vs. crisis trigger. Source: Bank of Japan, MOF.
Part IV — The Yen Falls Despite Rate Hikes
Despite the June hike to 1.00%, the highest policy rate since 1995, USD/JPY has weakened from roughly 161 to roughly 163 to 164 in late July. Japan posted a record ¥34.4 trillion current-account surplus, and yet the yen still falls, which is proof that capital outflow rather than trade is driving the currency. Every yen sold to buy USDC, Ripple USD, or gold tokens pushes the currency lower, deepening purchasing-power fear and accelerating the next wave of flight.
Part V — The Nikkei Correction, Misdiagnosed
The Nikkei has fallen more than 10% from its June peak into a technical correction, losing ¥82 trillion in three weeks and plunging roughly 4% on July 28 to a two-month low. The consensus blames a global semiconductor rout and AI-multiple compression, pointing to Advantest, Tokyo Electron, and Kioxia, all of which are down sharply.
That attribution is dangerously incomplete. The chip selloff is the visible trigger, but the underlying fragility is disintermediation, with Japanese depositors withdrawing capital from the domestic financial system into USD and gold tokenization. When the deposit base that funds domestic equity and bond demand shrinks, valuations turn brittle and any external shock cascades. The chip story is the excuse; the deposit exodus is the cause. Something is going to give, and the crack has already started.
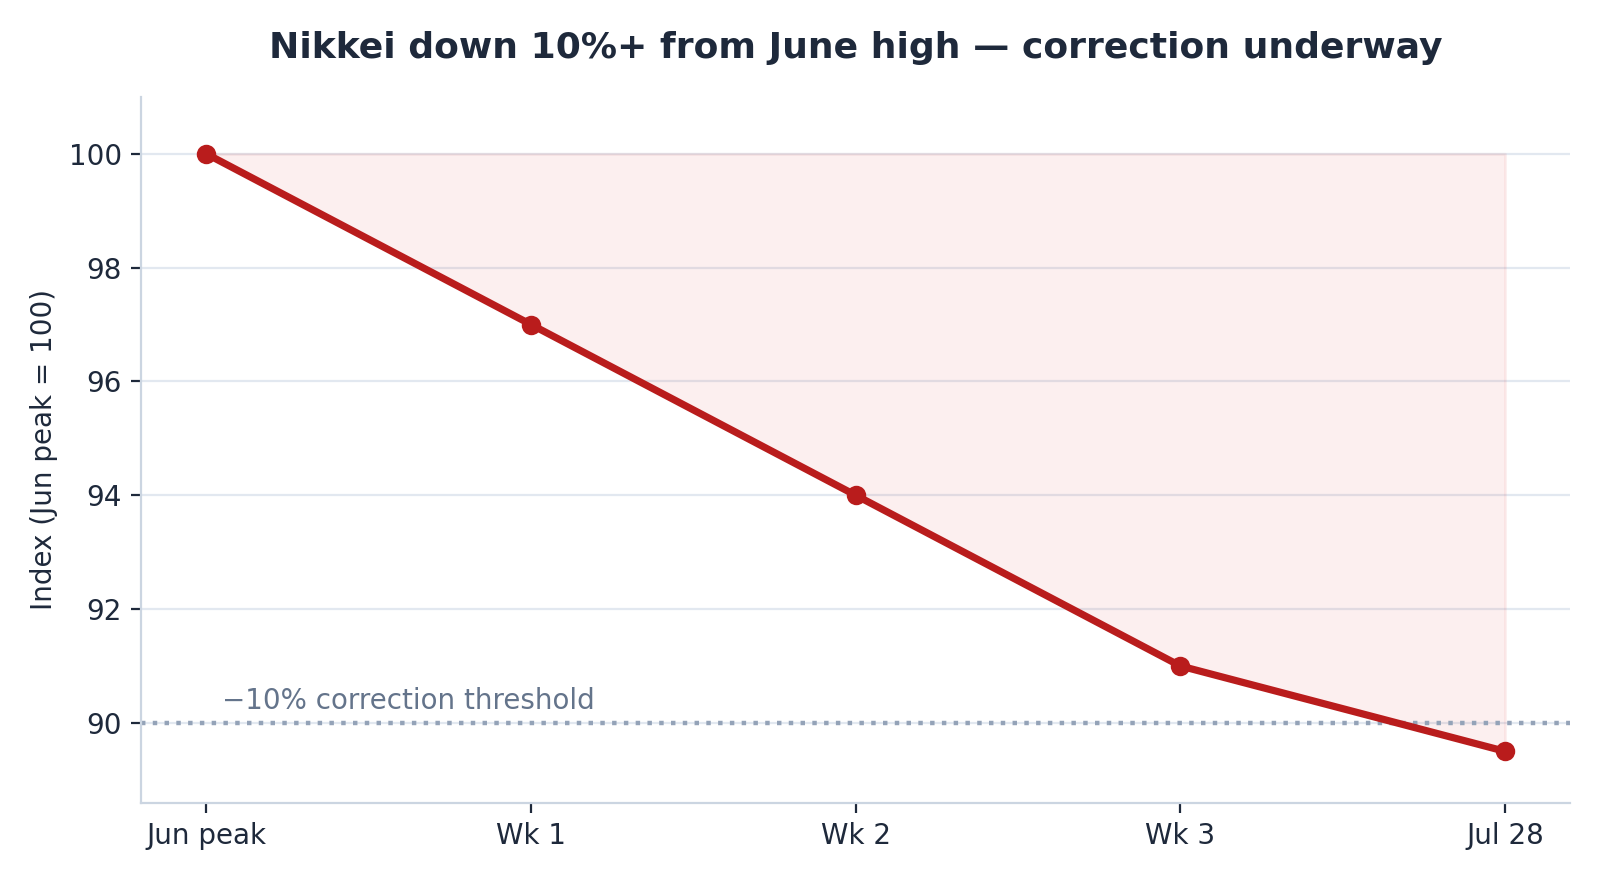
Nikkei 225 decline from June peak. Source: Reuters, Bloomberg, Nikkei.
Master Data Table
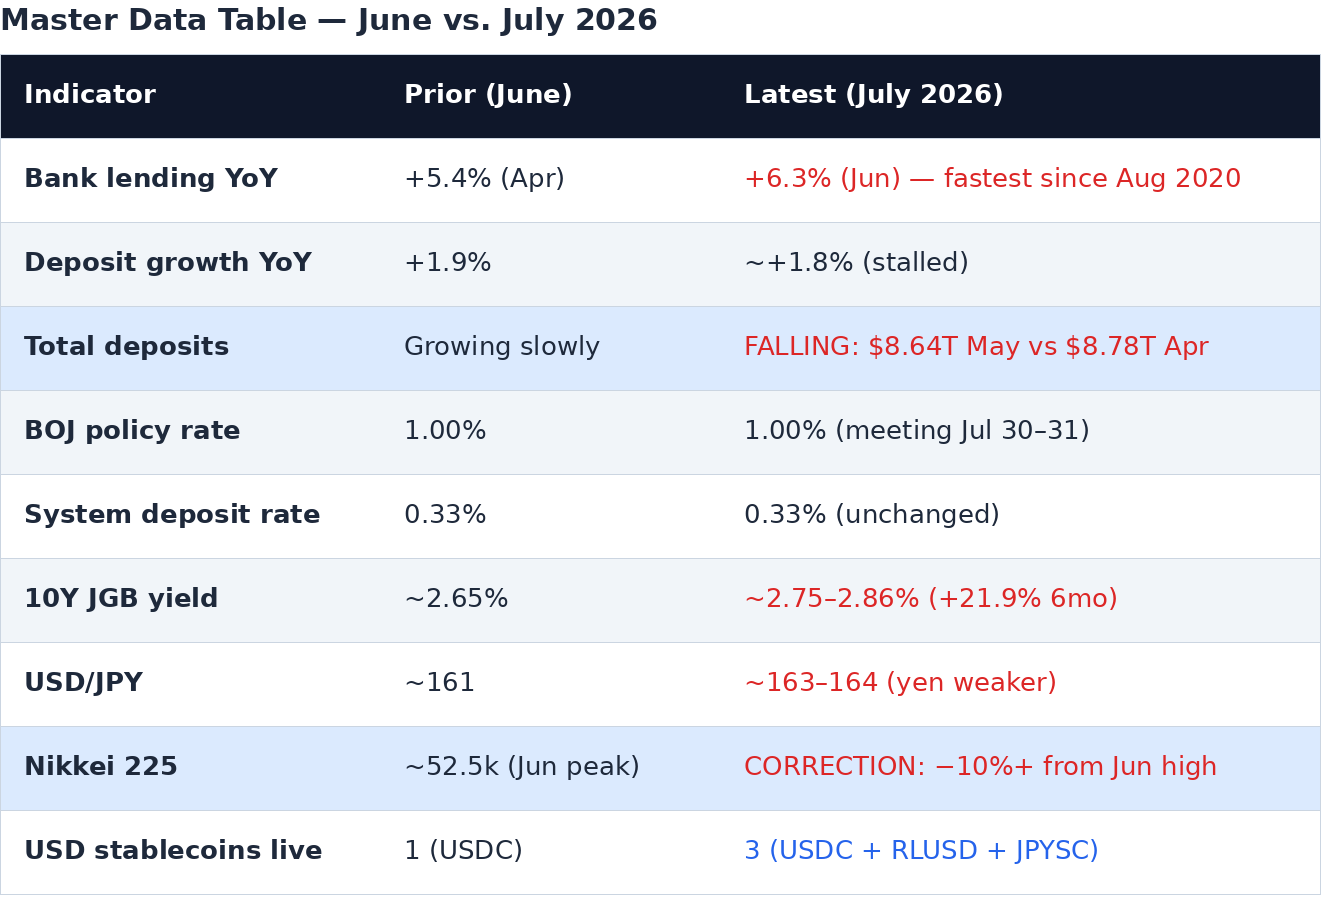
Key indicators, June vs. July 2026. Source: Bank of Japan, MOF, SBI VC Trade, Reuters.
Conclusion — Something Is Going to Give
The pieces have aligned into an unstable configuration. Deposits are actually declining. Three USD stablecoins are draining savings faster than expected. The government is buying less of its own debt while yields climb toward the danger zone. The yen keeps falling despite rate hikes. And the Nikkei correction, wrongly excused as a chip-cycle event, has already begun.
This is disintermediation by Japanese depositors into USD and gold tokenization, and it is pushing toward a massive bond- and stock-market correction. USD stablecoins and gold tokens remain the only assets that win across every scenario, and gold tokens uniquely pay off even in the equity-crash endgame now unfolding. Something is going to give.
Sources
- Bank of Japan deposit and lending statistics, stat-search.boj.or.jp
- SBI VC Trade / Ripple USD launch, sbivc.co.jp; Reuters coverage of the SBI–bitbank acquisition
- Ministry of Finance JGB data and BOJ taper schedule, mof.go.jp/english
- BOJ policy rate and MOF current-account balance, boj.or.jp/en
- Nikkei 225 index moves, Reuters and Bloomberg market reporting, July 2026
Data through 29 July 2026. Scenario probabilities and demand projections are illustrative analytical constructs, not market forecasts or investment advice. The authors hold positions in securities mentioned and reserve the right to buy or sell shares at any time without notice.