
From Ethylene to FLOPs


The 1960–1985 Plastics and Petrochemical Cycle as a Blueprint for the 2020s AI Compute Cycle
A consolidated report. Originally developed November 2025 through June 2026, marked to market through the close of Thursday, July 30, 2026. Suppliers versus buyers of compute, 28 tickers, four measurement windows, price-only equal-weighted baskets.
Executive Summary
In the 1960s, plastics were the miracle material that would change everything. In the 2020s, AI compute has played the same role. In both cases the early years were dominated by scarcity and extraordinary margins, followed by process innovation, a capacity race, and eventually commoditization. The history of plastics and petrochemicals from 1960 to 1985 is not merely an industrial anecdote. It is a blueprint, and it shows how a high-margin technology becomes a low-margin input, and why the durable wealth ends up accruing to specialists and downstream users rather than to bulk producers.
The original thesis, laid out from November 2025 and refined through February, April, and June 2026, held three things. The supplier layer — merchant chips, foundry, capital equipment, memory, and data-center landlords — was the modern analogue of bulk petrochemicals: critical, growing in volume, but structurally exposed to overbuild and margin compression. The buyer layer — companies that purchase compute and embed it in networks, workflows, and physical operations — was the modern analogue of specialty chemicals and downstream plastics converters, and should capture the durable value. And the turn would begin with margin anxiety and violent repricing in the supplier layer well before physical overcapacity became visible, then progress to sustained multiple compression in the late 2020s.
Marked to market through July 30, 2026, the framework's diagnosis is intact but its trade has not yet worked. The supplier basket has crushed the buyer basket over the full window. What has changed since the June update is that the first crack finally appeared. Over the five weeks from June 26 to July 30, the supplier basket fell while the buyer basket rose. That is one month of data, not a regime change, but it is the first month that moved in the direction the thesis predicted.
Part I — The Plastics Blueprint, 1960–1985
From roughly 1960 to the early 1970s, global plastics production exploded. Volumes grew at high single-digit to double-digit rates as plastics replaced glass, metal, wood, and paper in packaging, consumer goods, construction, and autos. DuPont, Union Carbide, Dow, and Monsanto in the United States, and ICI, BASF, and Hoechst in Europe, raced to build larger and more efficient plants. Initially this looked like a dream business, with few suppliers, patented processes, and new applications everywhere. Margins were robust and plastics were still seen as differentiated miracle materials.
To outcompete incumbent materials, producers leaned on process innovation and scale — bigger crackers, more efficient reactors, cheaper feedstocks. That made it possible to cut cost per pound, and producers began using low prices to pry open new markets. Pricing strategy shifted from skimming, which charges for novelty and performance, to penetration, which dominates tonnage through low unit cost. By the late 1960s plants had multiplied, multiple producers were selling nearly identical polymers, and pricing behavior had become commodity-like. The result was what executives later called profitless prosperity: volumes up, gross margins and returns on capital flat or falling. The key inflection came roughly between 1966 and 1970, when profits at several large players stagnated despite rising output.
A second structural shift arrived in the late 1970s and 1980s, when Saudi Arabia and other Gulf producers used cheap associated gas and large-scale crackers to build low-cost capacity. Western firms eagerly licensed their best technology and entered joint ventures even as they continued building plants at home. That combination — arming a low-cost hub while overbuilding in high-cost regions — ultimately crushed margins for commodity producers. Capacity overshot profitable demand, and the cheapest producers set global prices.
The winners were not the biggest bulk producers. They were the specialty chemical firms in additives, coatings, and performance materials that sold specific performance rather than tonnage, names like Lubrizol, Rohm & Haas, Sherwin-Williams, and PPG. And they were the downstream users in autos, tires, packaging, and consumer products that benefited from permanently cheaper plastic inputs, such as Goodyear and the converters.
Part II — The Mapping to AI Compute
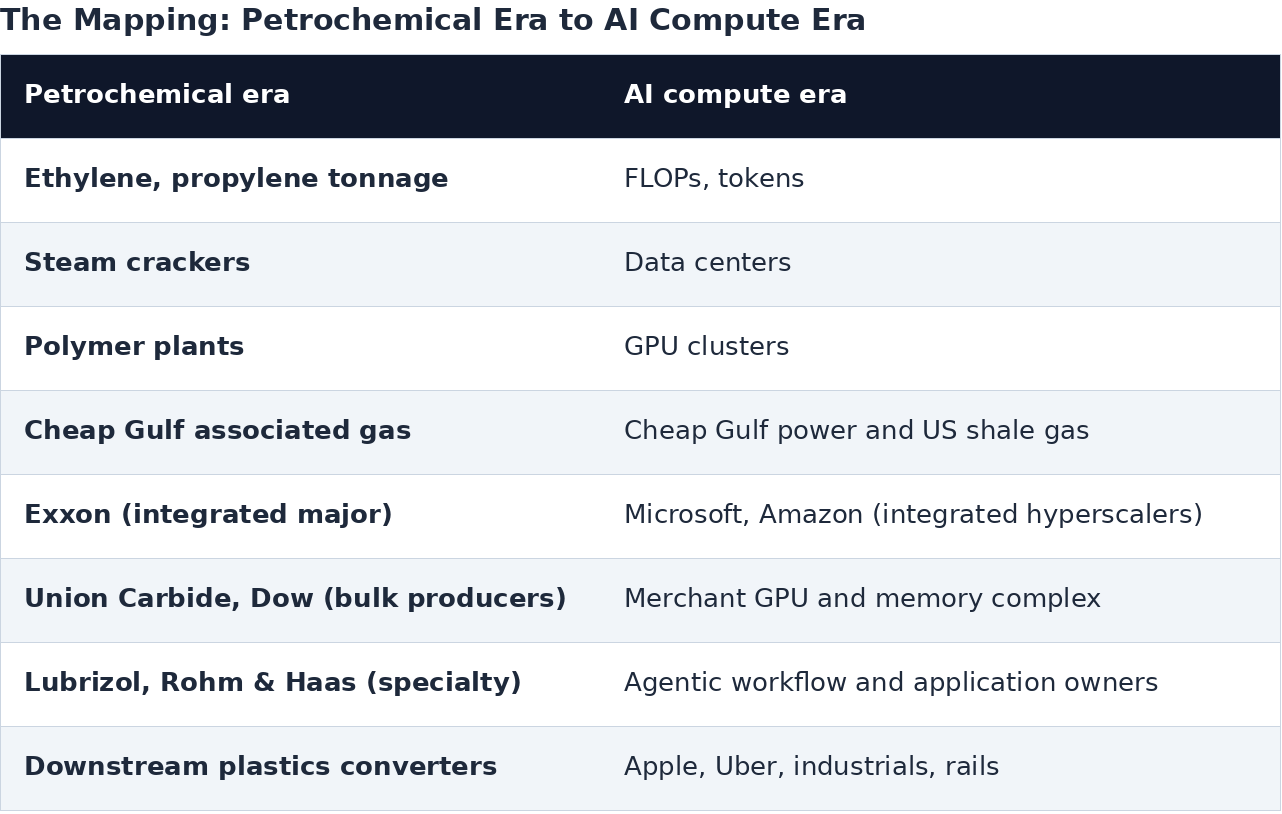
The structural correspondence between the two cycles.
Four dynamics were identified as pushing compute toward commodity behavior. The first is faster technology cadence, in which new chip generations arrive quickly, devaluing older hardware and forcing buyers and rivals into a perpetual upgrade race. The second is custom silicon and the shift from buying to building, as hyperscalers and large OEMs design their own accelerators and ASICs, reducing dependence on merchant GPUs and attacking price-performance directly. The third is the global capacity race, in which the United States and Europe build aggressively even in high-cost power regions while Gulf states explicitly position themselves as low-cost AI hubs, an exact echo of their petrochemical strategy. The fourth is the flip in pricing logic, as margins become increasingly tied to volume and cost per FLOP rather than scarcity, and the supplier layer starts to look and trade like a cyclical, capital-intensive industry.
Part III — The Original Winners and Losers List, February 2026
The February 2026 article divided the universe into two cohorts. On one side sat the compute buyers, the businesses expected to treat compute as a declining input cost while their own scarce asset — a network, a customer endpoint, a physical footprint, a system of record — appreciated.
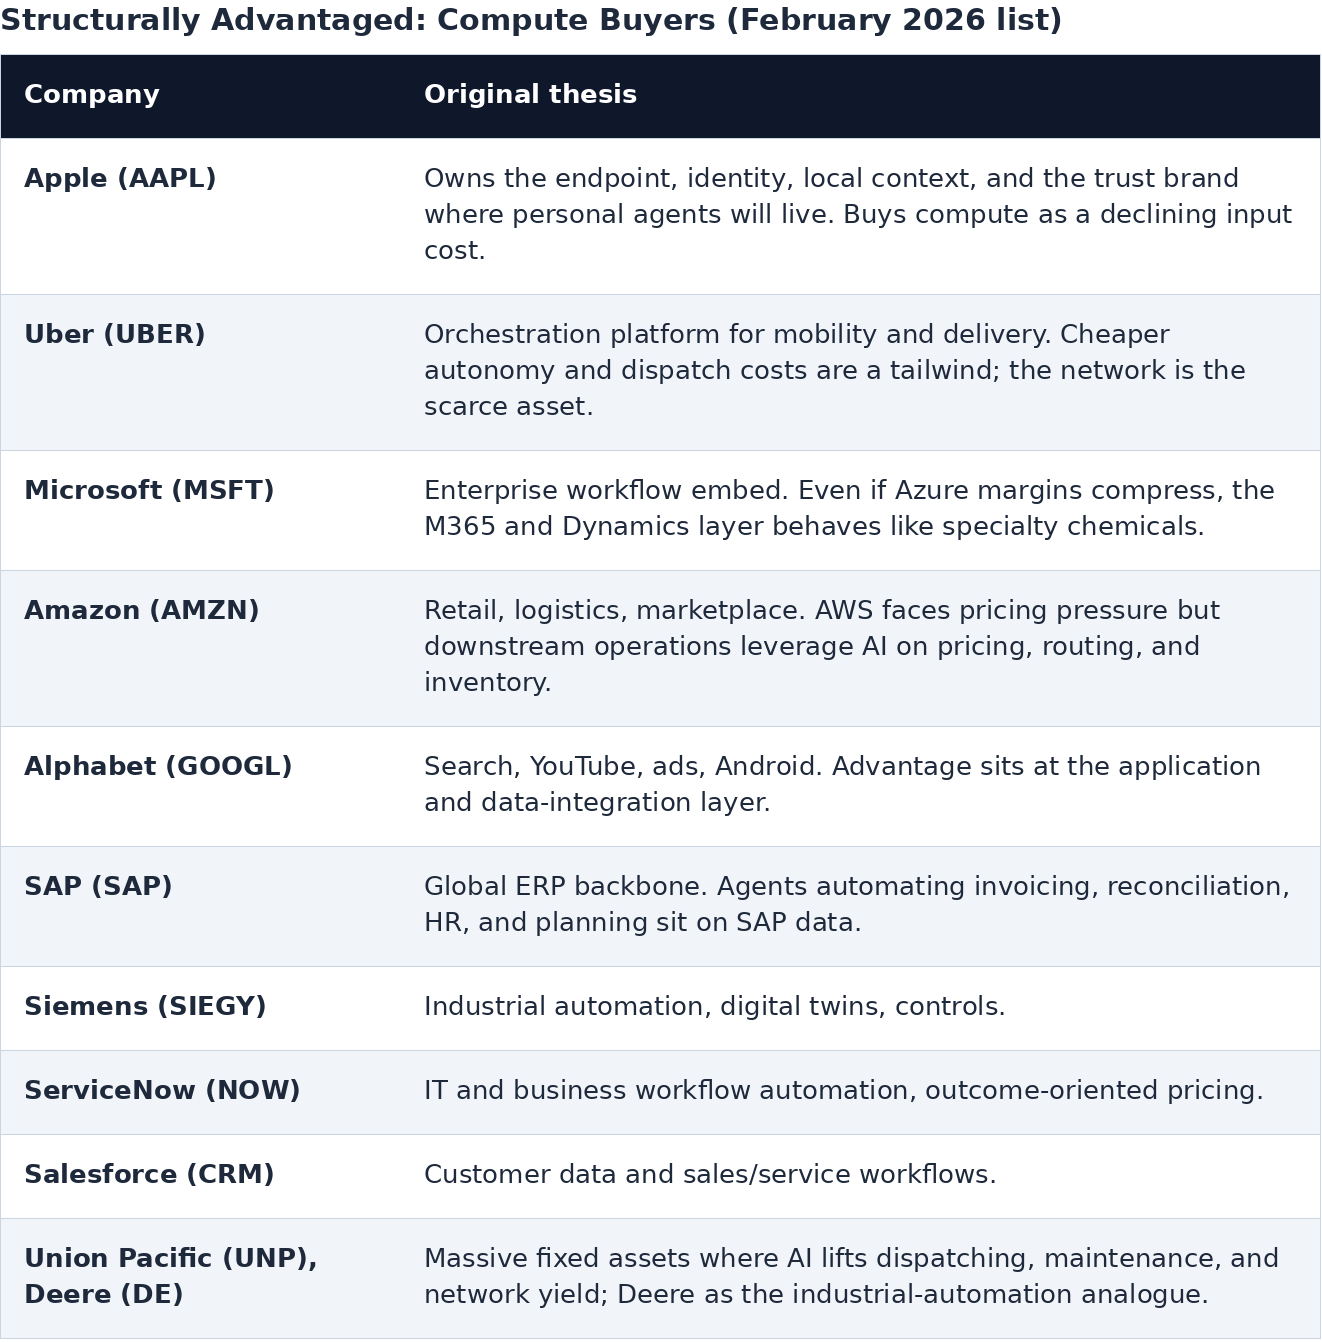
The buyer cohort as originally framed.
On the other side sat the suppliers and landlords, the businesses expected to be repriced as cyclical, capital-intensive commodity producers once volume rather than scarcity began to set margins.
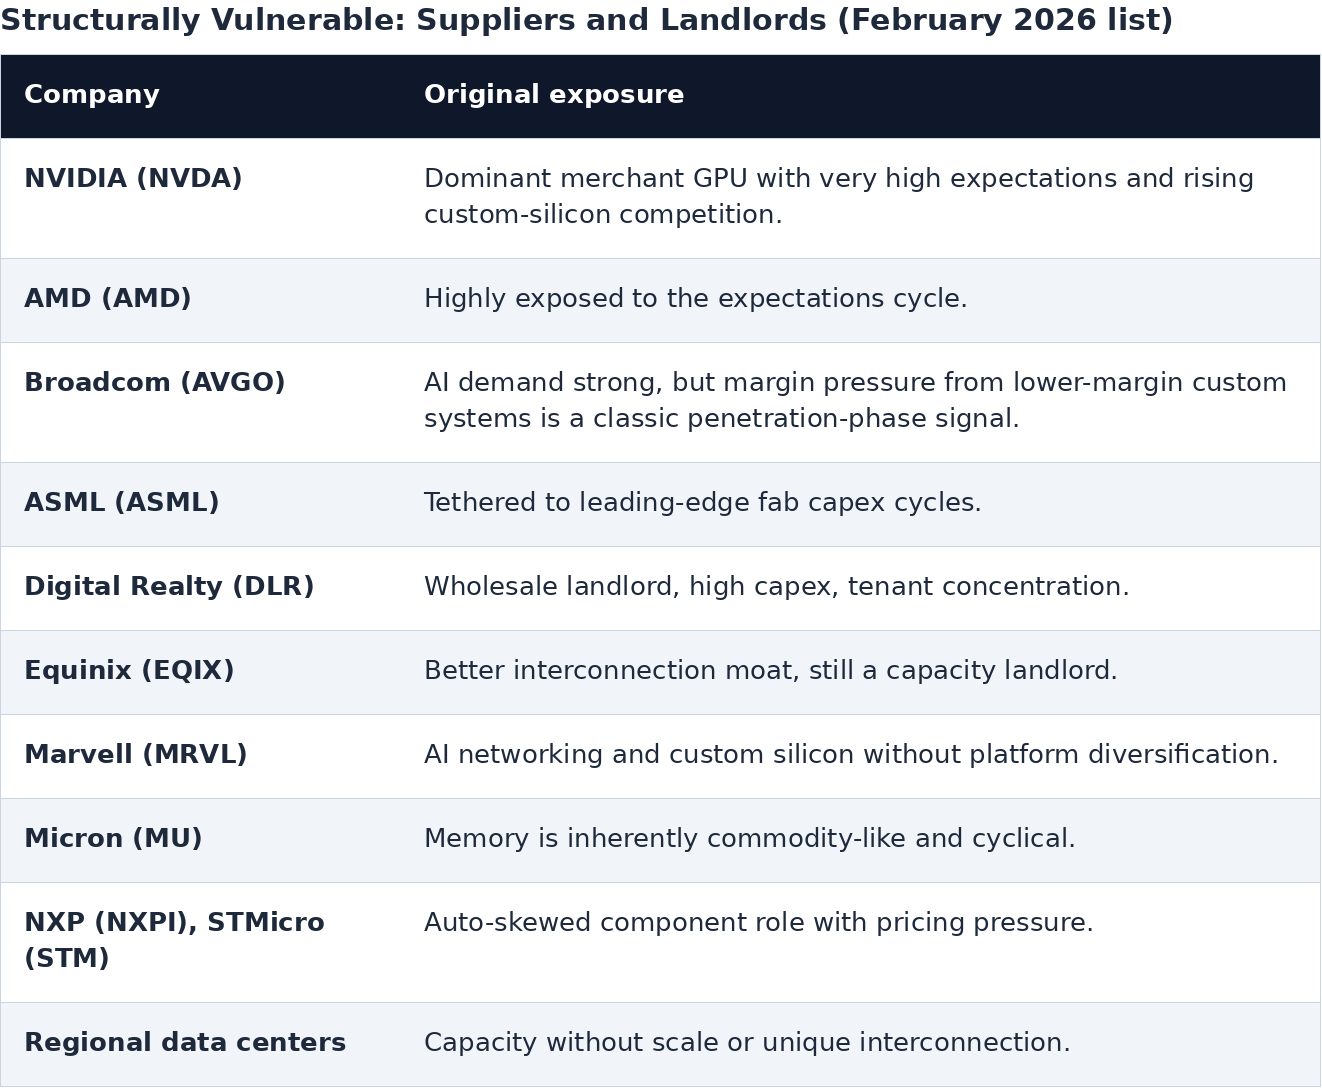
The supplier cohort as originally framed.
Three further names were tracked across the channel without being assigned to either basket: TSMC as the foundry chokepoint, AmpliTech as the small-cap RF and ASIC play, and Palantir, Snowflake, and UiPath as the agentic and specialty software layer.
Part IV — The April 2026 Revision: Iran, Gulf Risk, and the US Gas Advantage
Iranian strikes on Middle East energy and cloud infrastructure materially changed the timing, though not the logic. Gulf capacity was delayed rather than cancelled: greenfield AI campuses that depended on cheap, secure, uninterrupted power and water now face a security and insurance premium, with reports putting severe damage across at least forty Middle East energy assets in nine countries and rebuild costs above $25 billion.
The United States gained a temporary cost and risk advantage in the process. Gas-fired generation now accounts for more than half of US power capacity under development, much of it tied to AI data centers. If Gulf projects slip while US gas-backed campuses advance, the United States becomes the lowest-risk and possibly the lowest all-in delivered-cost provider of large-scale compute. Chip redirection is only partial, since future allocations including Gulf front-of-line shipments can be reabsorbed domestically while already-built and already-contracted capacity does not relocate.
Europe and Asia are not shut down either. Europe was already structurally weak, potentially under 5% of new AI-optimized capacity, but Northern Europe, India, and Southeast Asia may absorb rerouted development, and Microsoft's Singapore and Thailand commitments argue against a regional freeze. The net effect on the timeline is that multiple contraction for the supplier layer is pushed right. Higher for longer, not permanently higher.
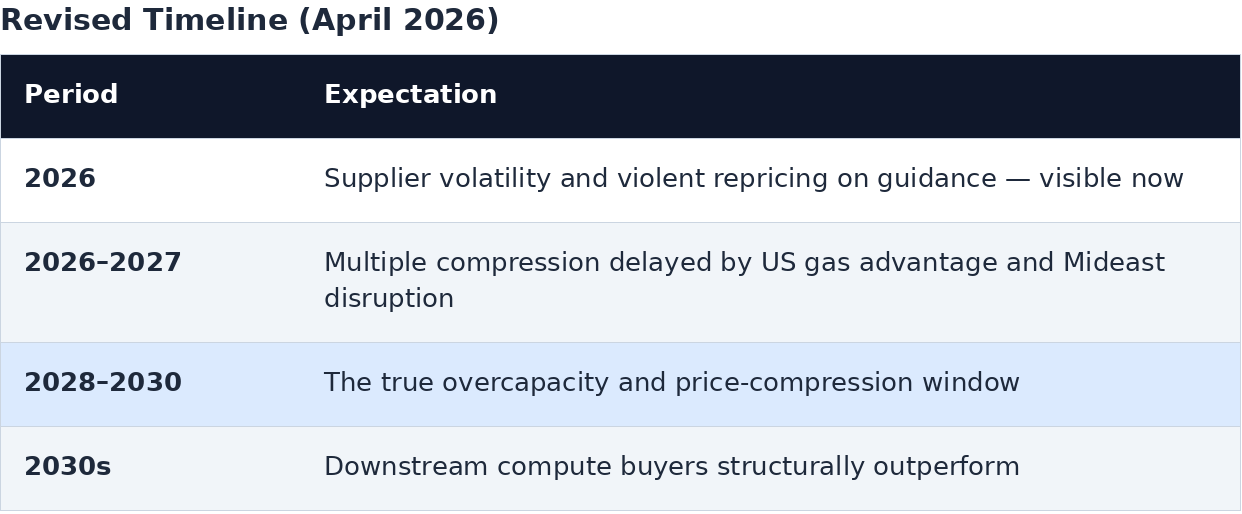
The revised timeline, with the overcapacity window pushed to 2028–2030.
Part V — Performance Update Through July 30, 2026
All prices are daily closes, and four measurement windows are used. November 4, 2025 is thesis inception, when the channel first framed the plastics analogy. February 4, 2026 is the AMD single-day drawdown and the date of the original winners and losers article. June 26, 2026 is the last channel price check. July 30, 2026 is the most recent completed session.
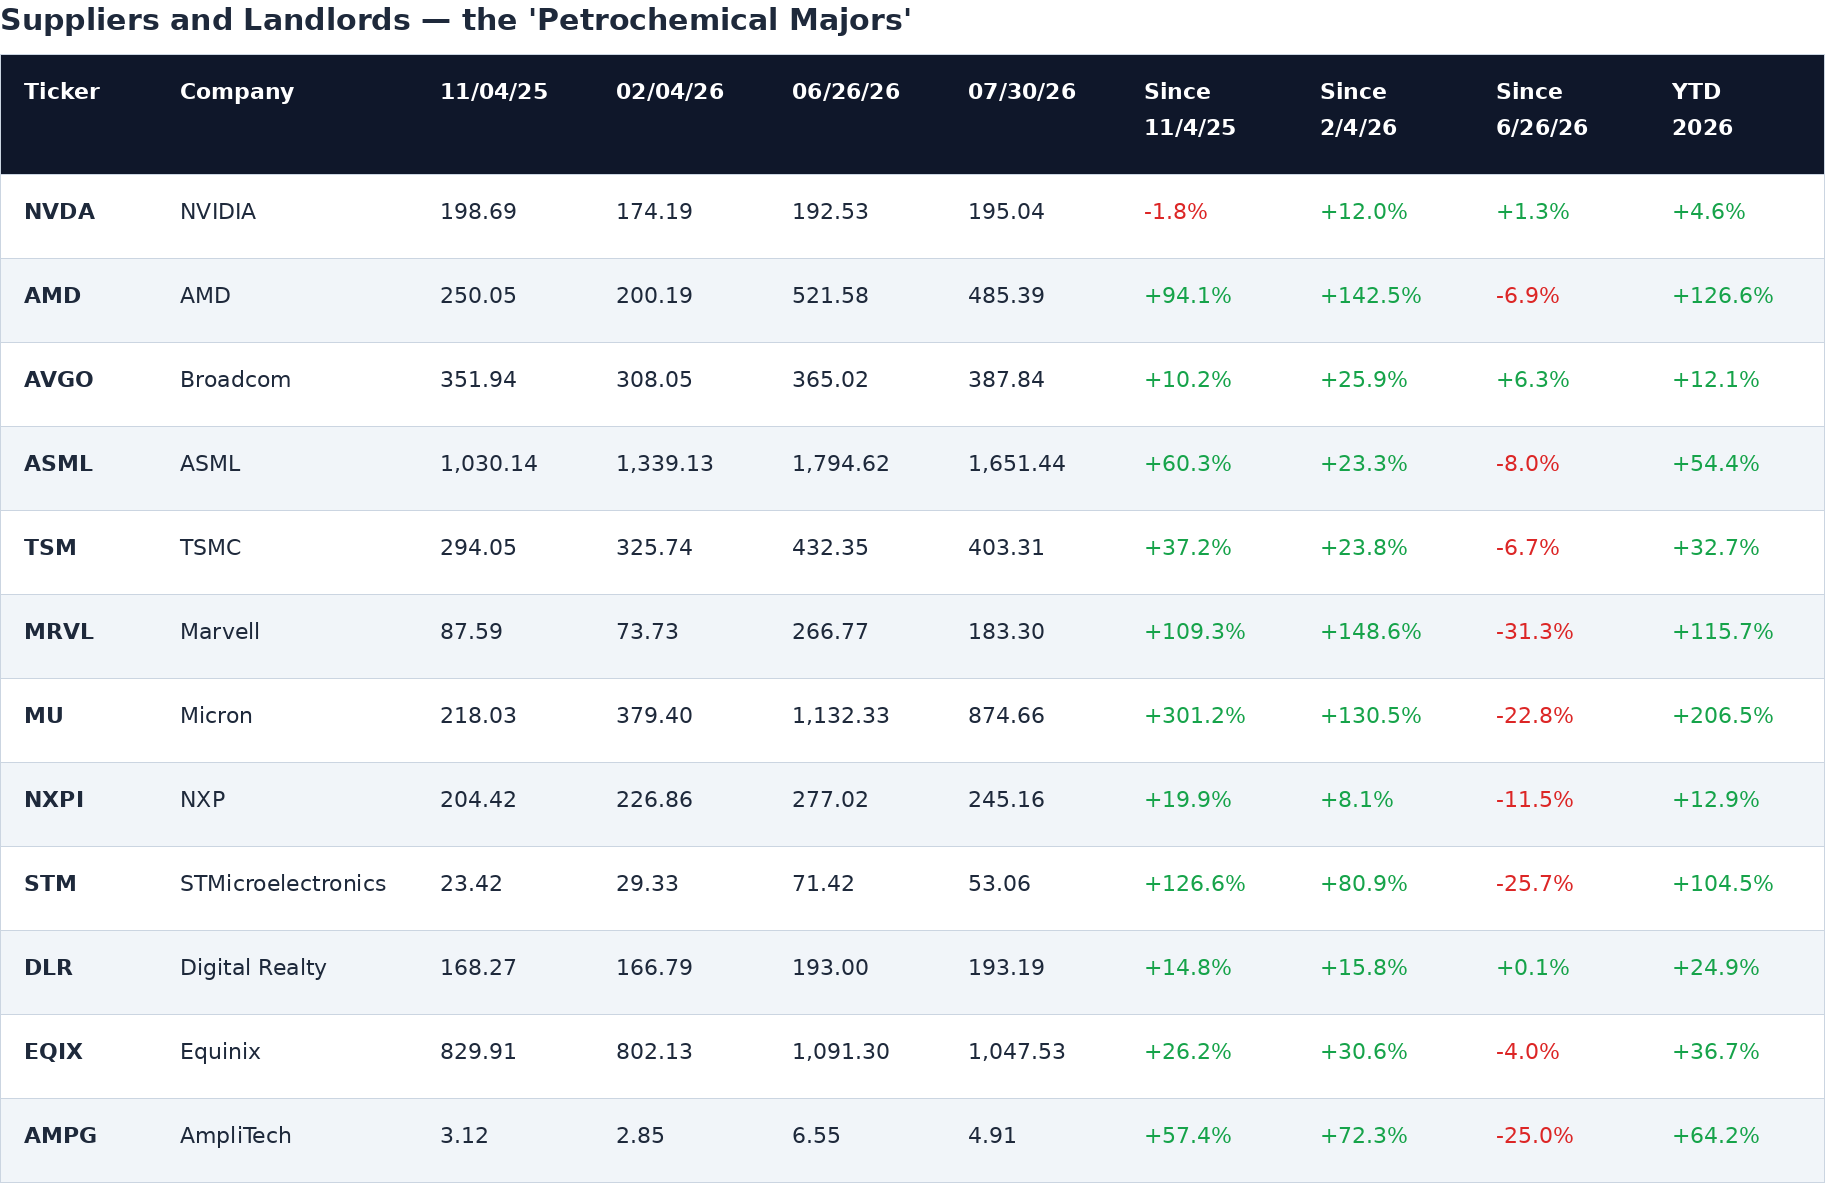
Suppliers and landlords, the modern bulk petrochemical majors.
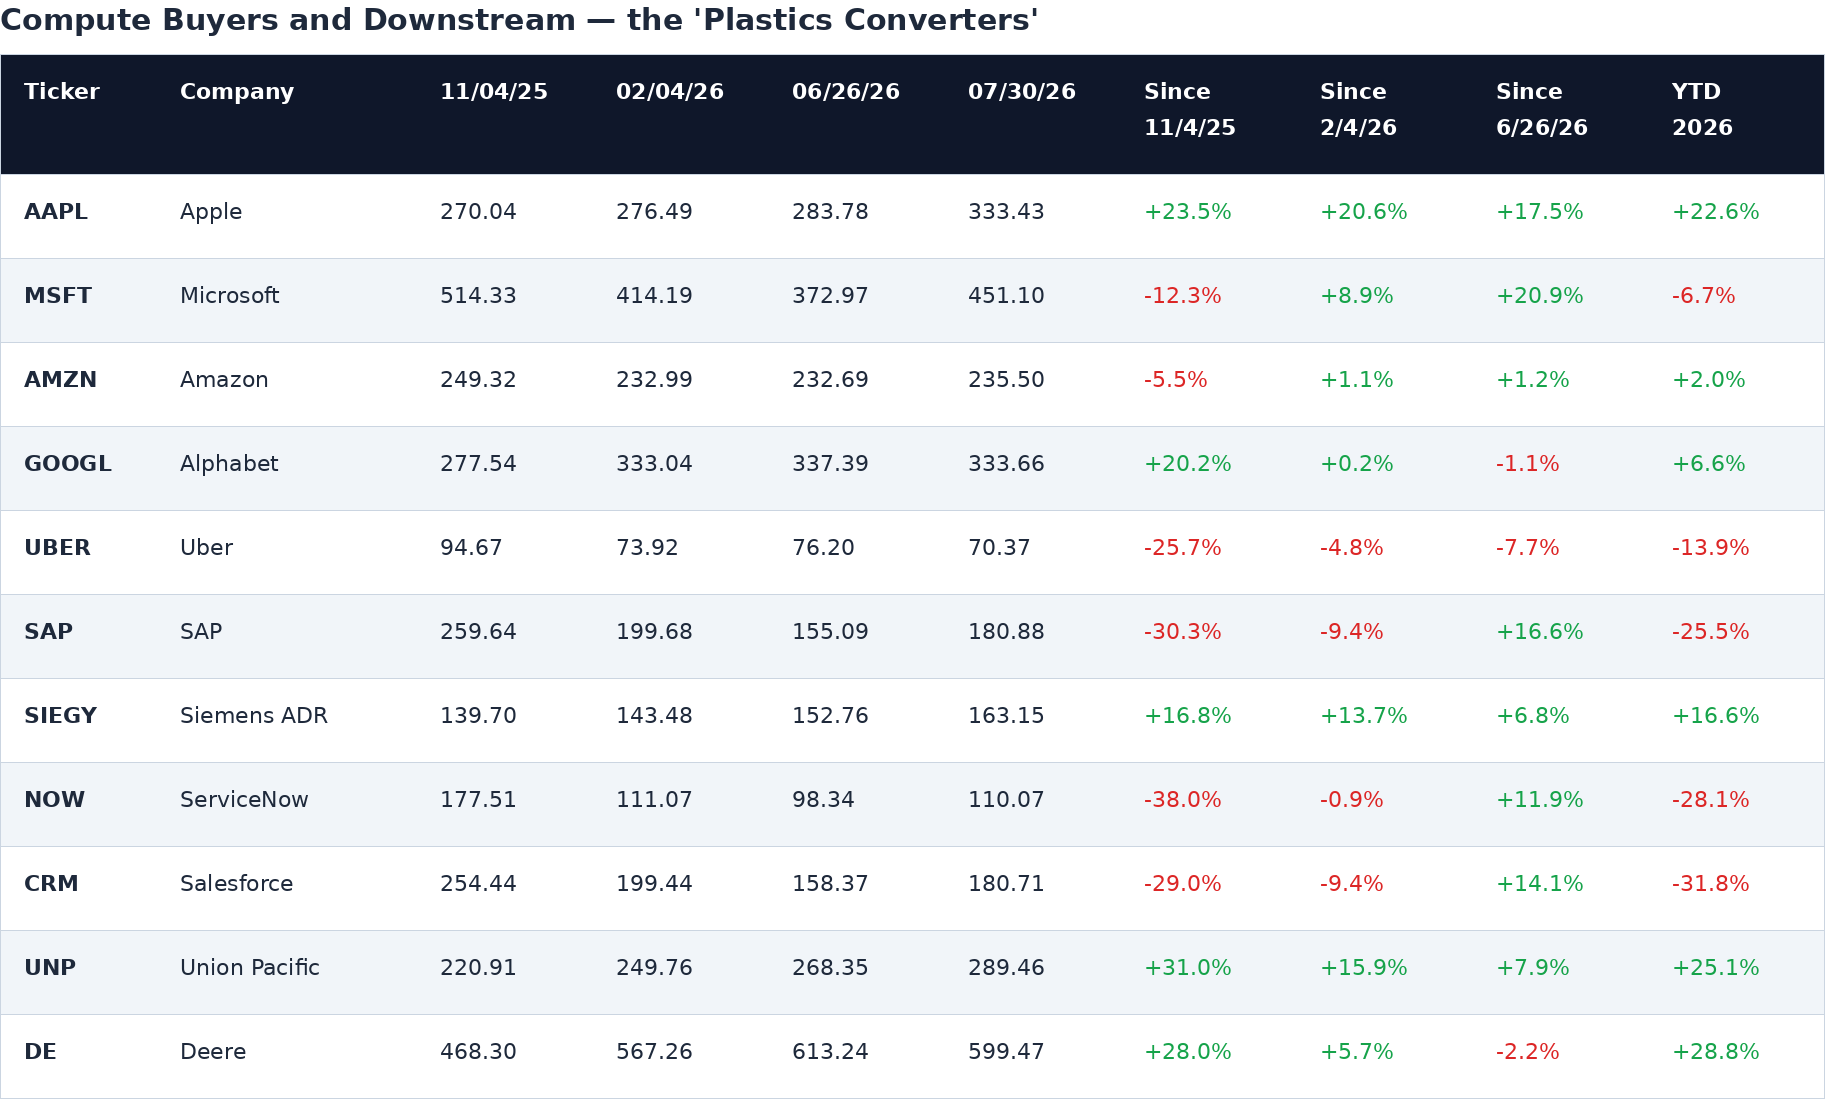
Compute buyers and downstream operators, the modern plastics converters.
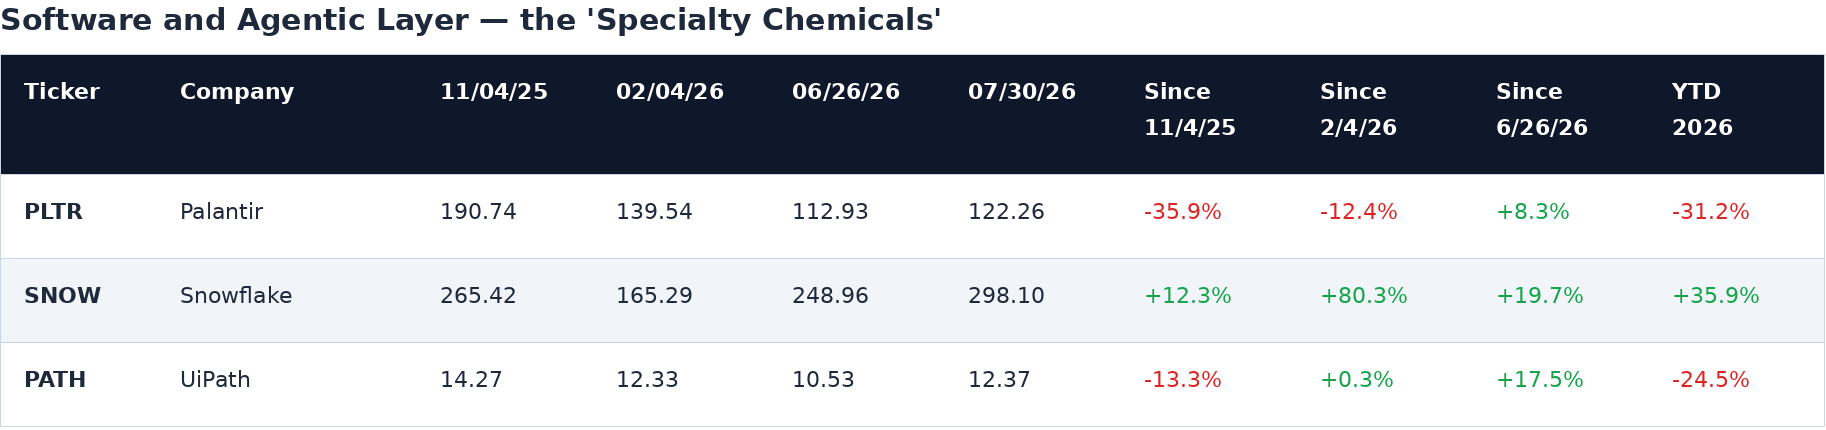
The software and agentic layer, originally cast as the specialty chemicals.

Benchmarks over the same four windows.
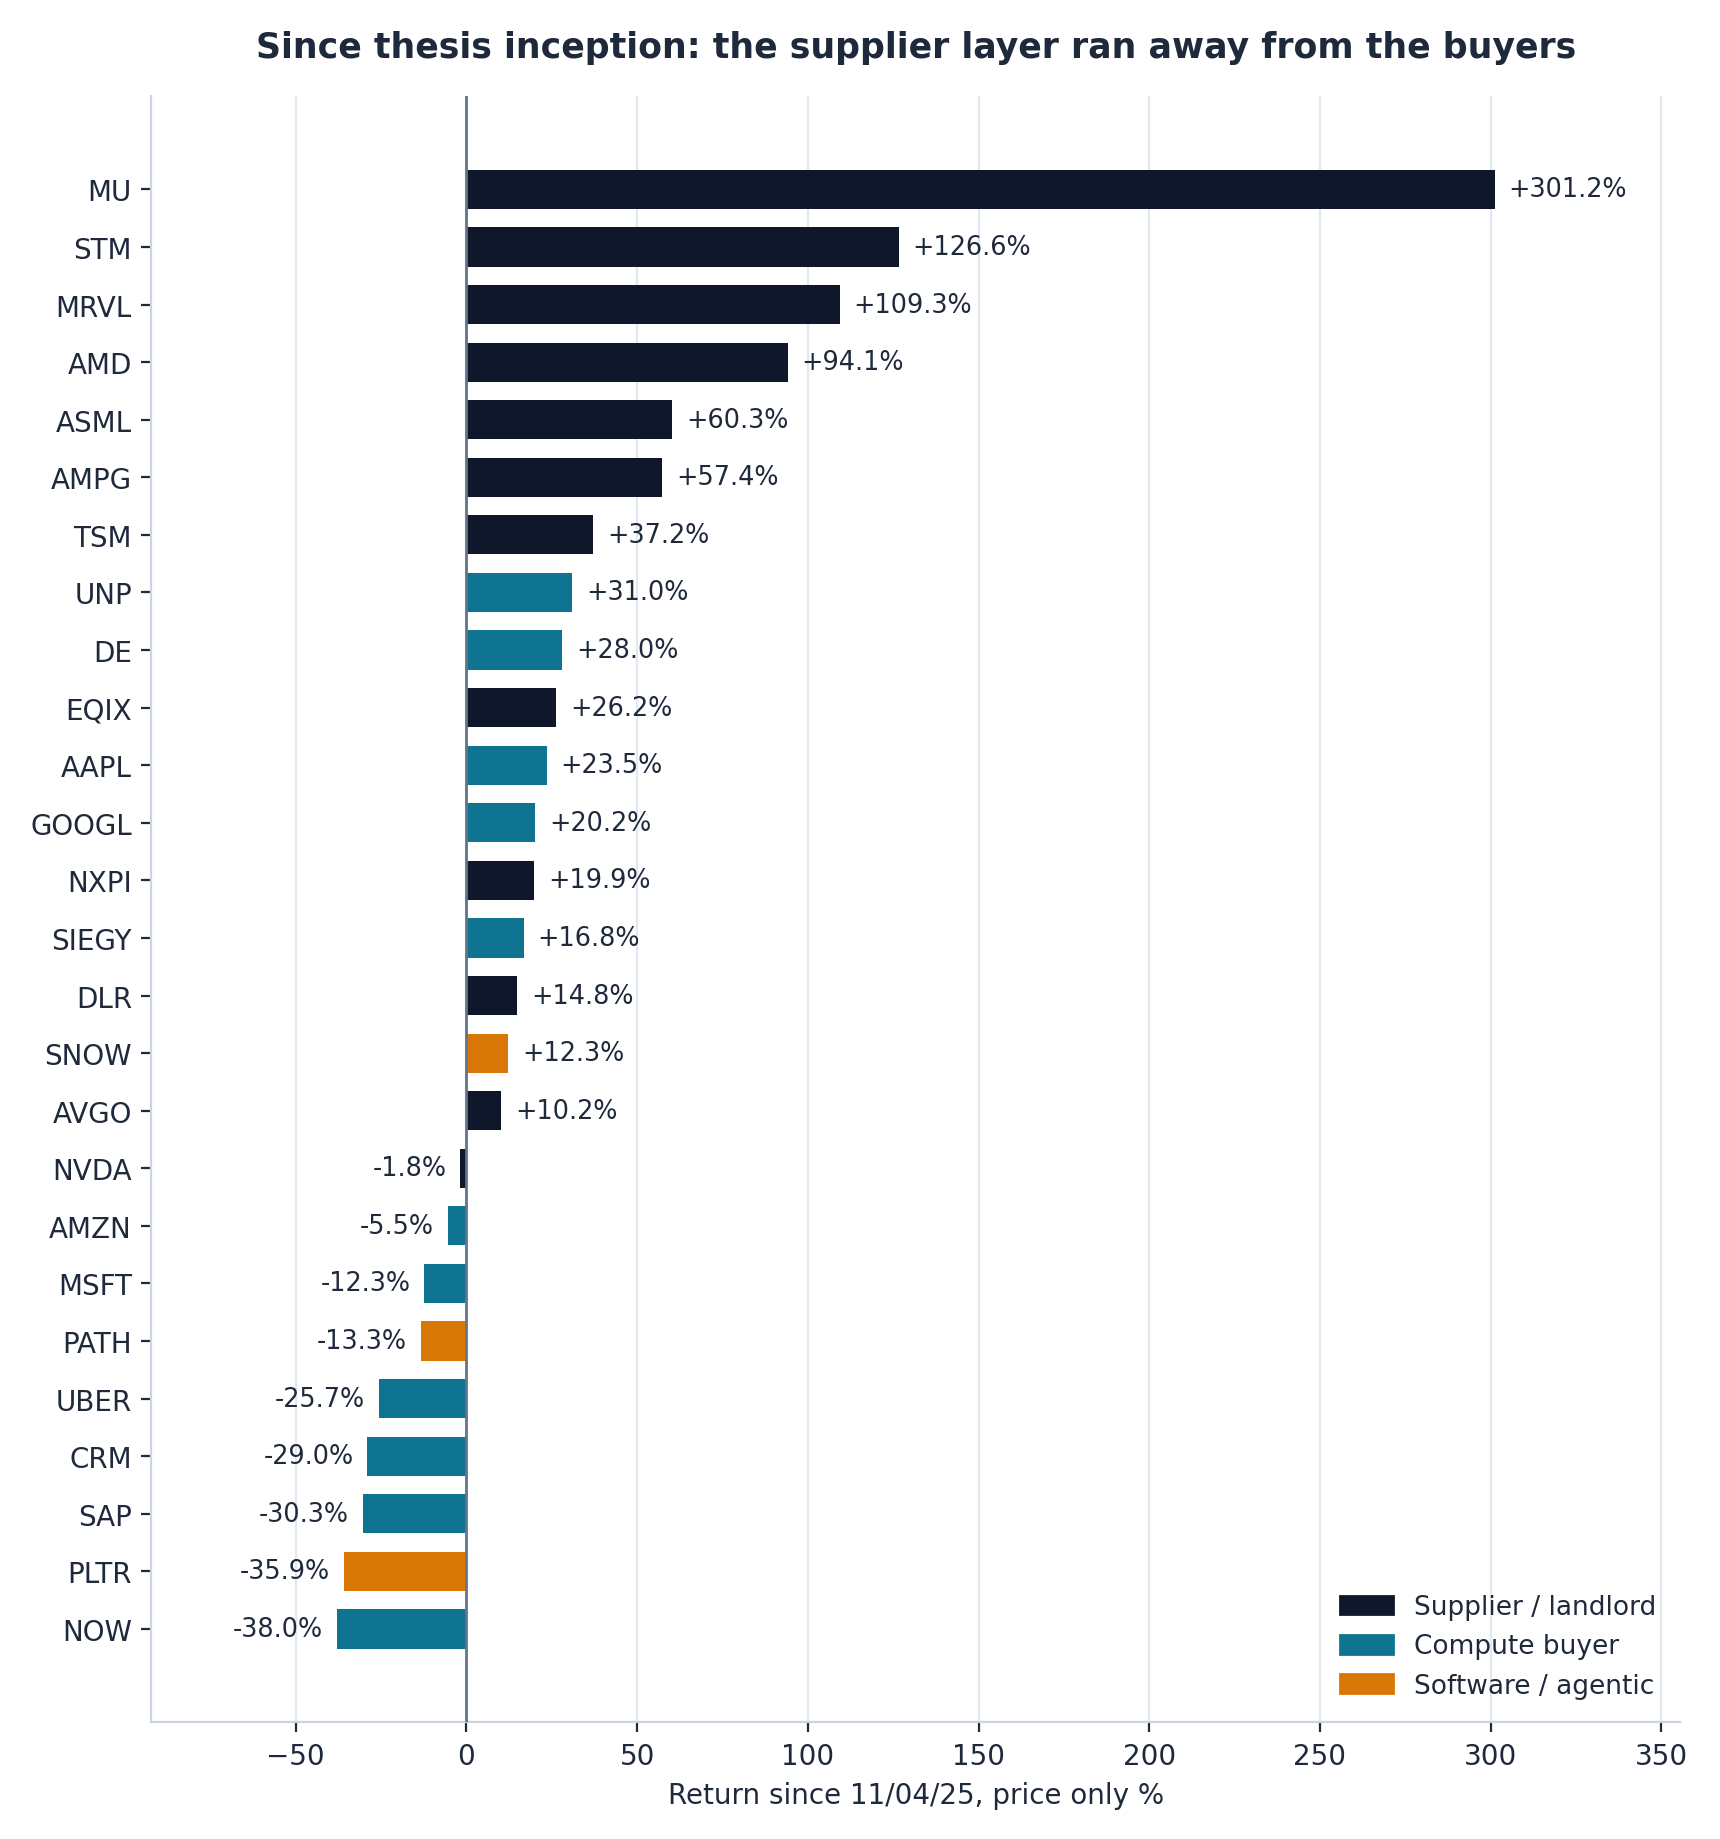
Every tracked name, ranked by price-only return since thesis inception. Source: daily closes, November 4, 2025 through July 30, 2026.
Part VI — Scorecard: Did the Thesis Work?
The verdict on the full window is no. Since November 4, 2025, the equal-weight supplier basket returned 71.3% against negative 1.9% for the equal-weight buyer basket, a spread of roughly 73 points in exactly the wrong direction. Over the same window the S&P 500 gained 9.8% and the Nasdaq Composite 7.6%.
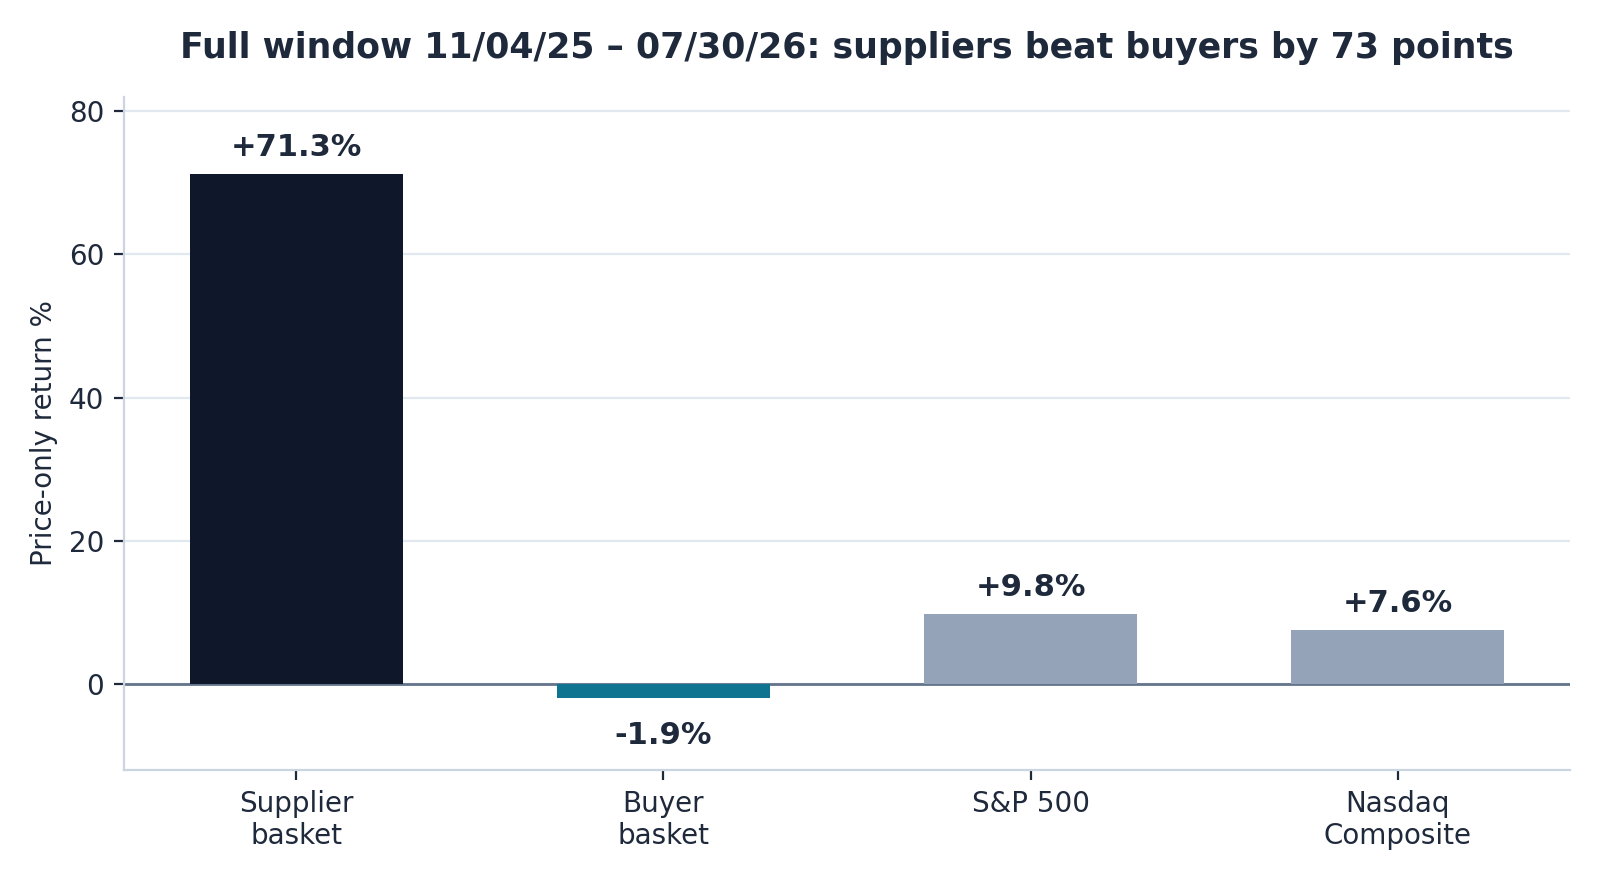
Equal-weighted, price-only basket returns from thesis inception through July 30, 2026.
The forecast was that suppliers would be repriced as commodity cyclicals. Instead Micron, nominated as the most commodity-like name on the list, is the single best performer in the entire study, up 301.2% from thesis inception. Memory pricing did not behave like a commodity in a glut; it behaved like a shortage. STMicroelectronics, Marvell, and AMD all more than doubled or nearly doubled. ASML and TSMC, the names tethered most tightly to the capex cycle, reflect a capex cycle that accelerated rather than digested. Even the landlords held, with Equinix up 26.2% and Digital Realty up 14.8%.
Meanwhile the designated winners largely failed. ServiceNow fell 38.0%, SAP 30.3%, and Salesforce 29.0% — the enterprise workflow layer, the closest analogue to specialty chemicals, was the worst-performing cohort in the entire study. Uber, the flagship orchestration thesis, is the second-worst individual name at negative 25.7%. Microsoft and Amazon both lagged the index. Only four buyer-side names delivered: Union Pacific, Deere, Apple, and Alphabet. All four are physical-asset or endpoint businesses rather than software workflow layers. The part of the buyer thesis that rested on owning fixed infrastructure and the customer endpoint held up. The part that rested on selling agentic software seats did not.
Three things went wrong with the analogy. First, the Gulf shock removed the low-cost competitor. In the plastics case, the Saudi crackers were the mechanism that broke commodity pricing; in the compute case, that mechanism was disabled in April 2026, and if you take away the cheap-feedstock hub, the overcapacity clock stops. Second, memory ran the wrong way, and Micron's move argues that the compute buildout is still supply-constrained at the component level.
Profitless prosperity requires supply to arrive. It has not yet.
Third, the buyer layer was hit by its own disruption. Enterprise software never got to enjoy compute as a cheap input, because agents attacked the seat-based licensing model directly. The specialty-chemical analogue assumed the specialist's product was safe. It was not. ServiceNow, Salesforce, SAP, and Palantir all fell hard while compute got more expensive rather than cheaper.
The one crack: the last five weeks
Between June 26 and July 30, 2026, the pattern inverted for the first time. The supplier basket fell 11.2% while the buyer basket rose 7.8%, against 1.1% for the S&P 500 and negative 0.7% for the Nasdaq Composite.
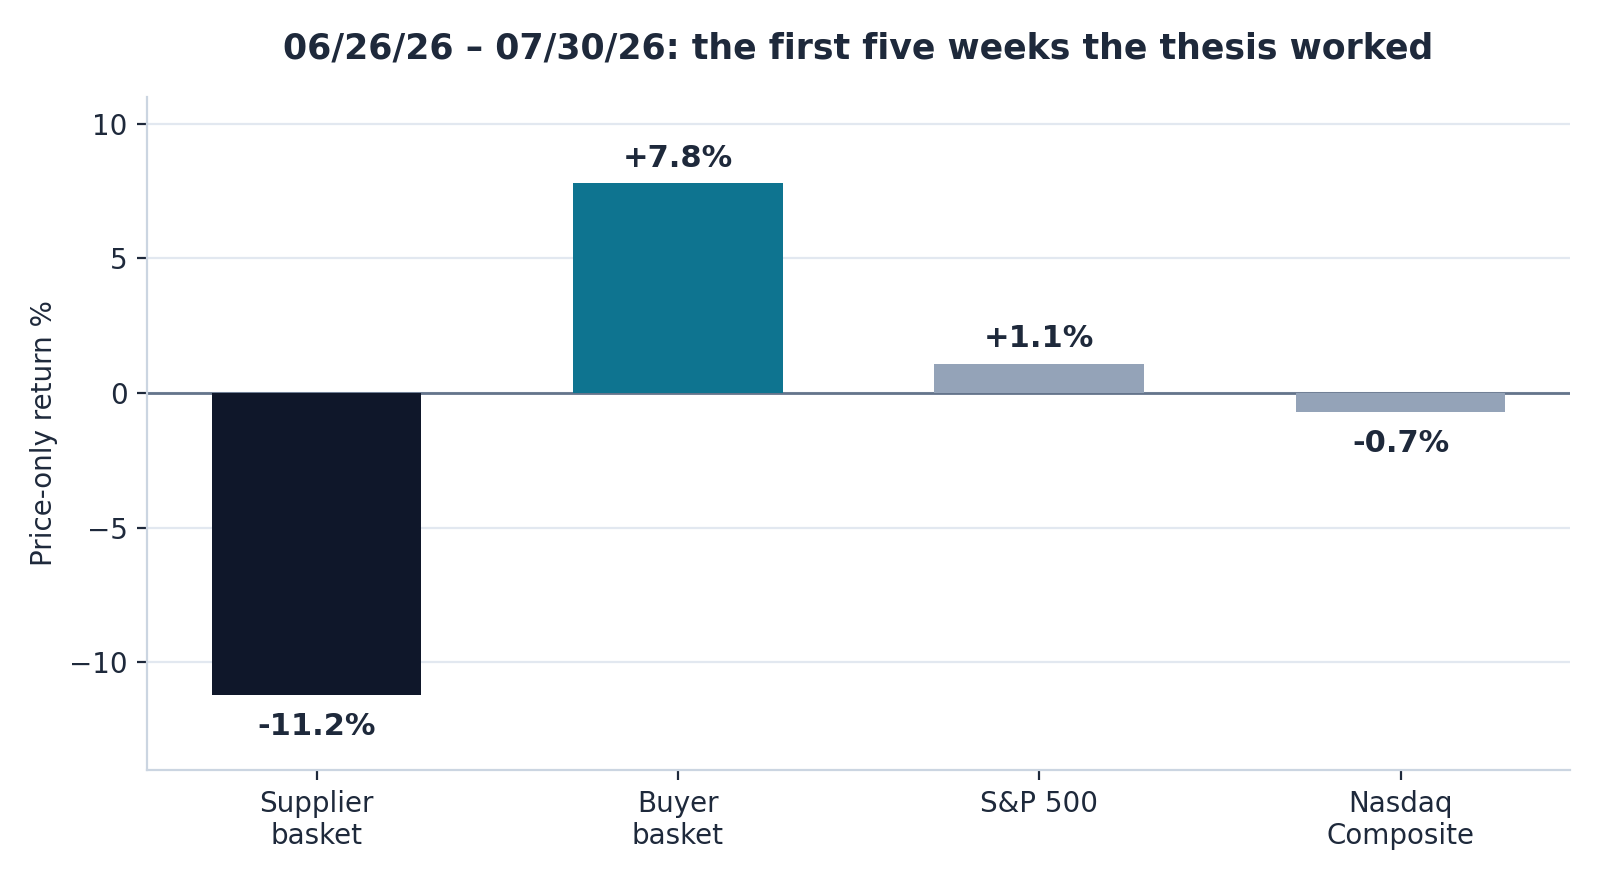
The June 26 to July 30 window, the first stretch in which the thesis trade was profitable.
The drawdowns are concentrated exactly where the thesis said they would be. Marvell fell 31.3%, STMicroelectronics 25.7%, AmpliTech 25.0%, Micron 22.8%, NXP 11.5%, and ASML 8.0%. Meanwhile Microsoft rose 20.9%, Apple 17.5%, SAP 16.6%, Salesforce 14.1%, and ServiceNow 11.9%.
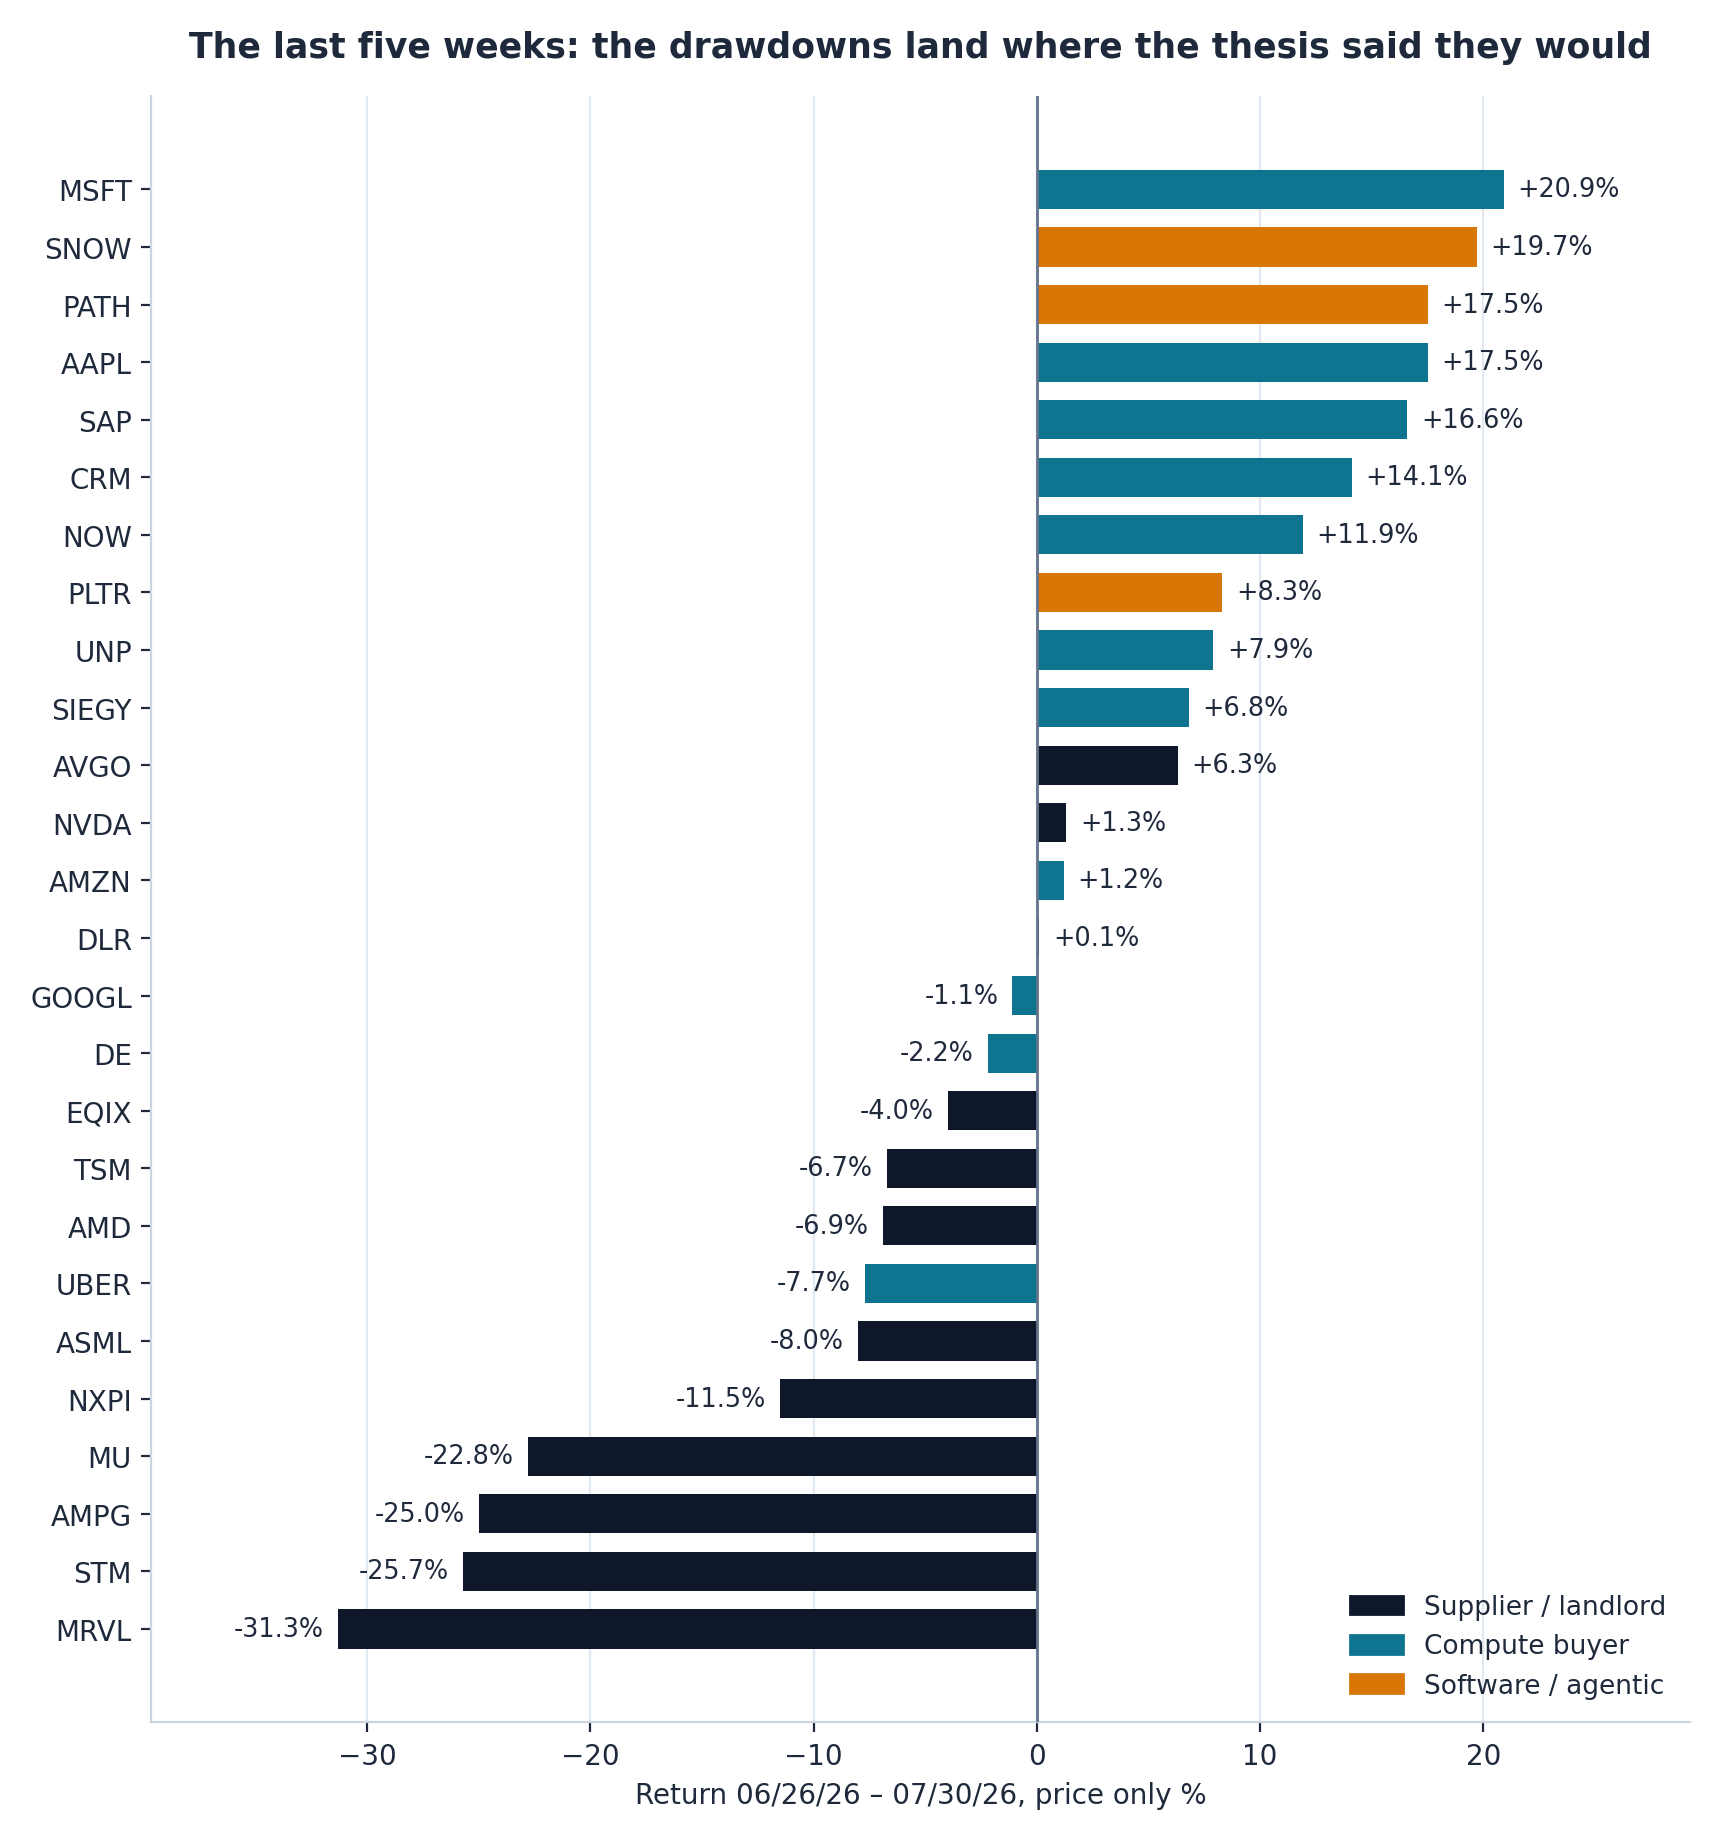
The same universe over the five-week window, ranked by return.
That is the first five-week stretch in the entire nine-month window in which the thesis trade was profitable, and it was profitable by roughly 19 points. One month is not a regime. But it is the shape the framework predicted, arriving in the sequence the framework predicted: supplier margin anxiety first, then relative rotation.
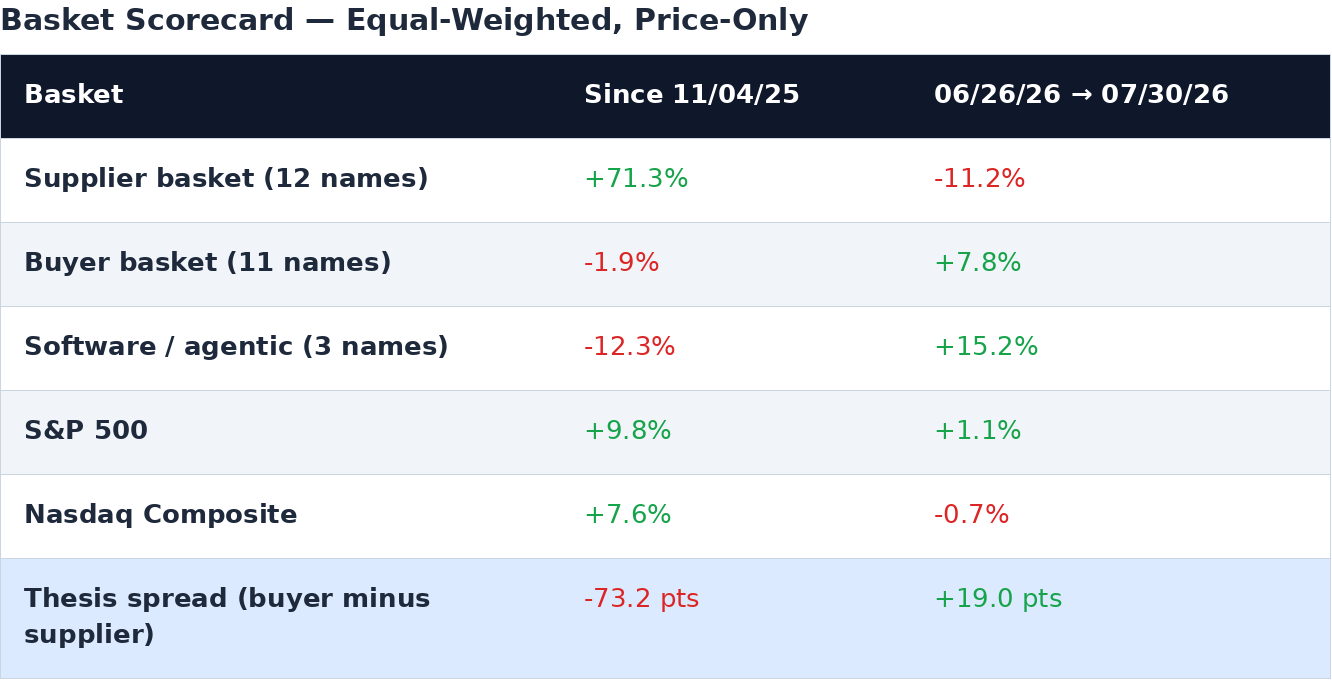
Basket scorecard across both windows. The software and agentic layer is tracked separately and is not included in either basket.
Part VII — Where This Leaves the Framework
Keep the structural logic. Bulk inputs commoditize, and specialists and downstream users capture durable value. Nothing in the 2026 data disproves that.
Revise the timing. The April 2026 revision, which held that Gulf disruption pushes the overcapacity window to 2028 through 2030, is now the operative case, and the July supplier drawdown is consistent with an early tremor rather than the main event.
Correct the assumption that enterprise workflow software is the modern Lubrizol. The evidence through July 2026 is that agentic AI is a substitute for seat-based enterprise software, not a margin enhancer for it. The better specialty-chemical analogues appear to be businesses whose moat is a physical or regulatory asset that AI makes more productive — rails, industrials, and the device endpoint — rather than businesses whose moat is a software workflow that AI can simply rebuild.
That correction has a direct positioning consequence. Salesforce and ServiceNow come out of the buyer expression entirely. In their place, buy the transport ETF and the Dow Jones Industrials ETF. Transports are the purest available expression of the part of the thesis that actually worked, since rails and freight networks are fixed physical assets that AI makes more productive without threatening the moat itself, and Union Pacific was among the only four buyer-side names to deliver over the full window. The Dow Industrials ETF extends the same logic across the broad asset-heavy old economy, capturing operators that buy compute as a declining input cost rather than selling it. Both are index expressions rather than single-name bets, which is the appropriate humility given that the single-name buyer list underperformed by 73 points.
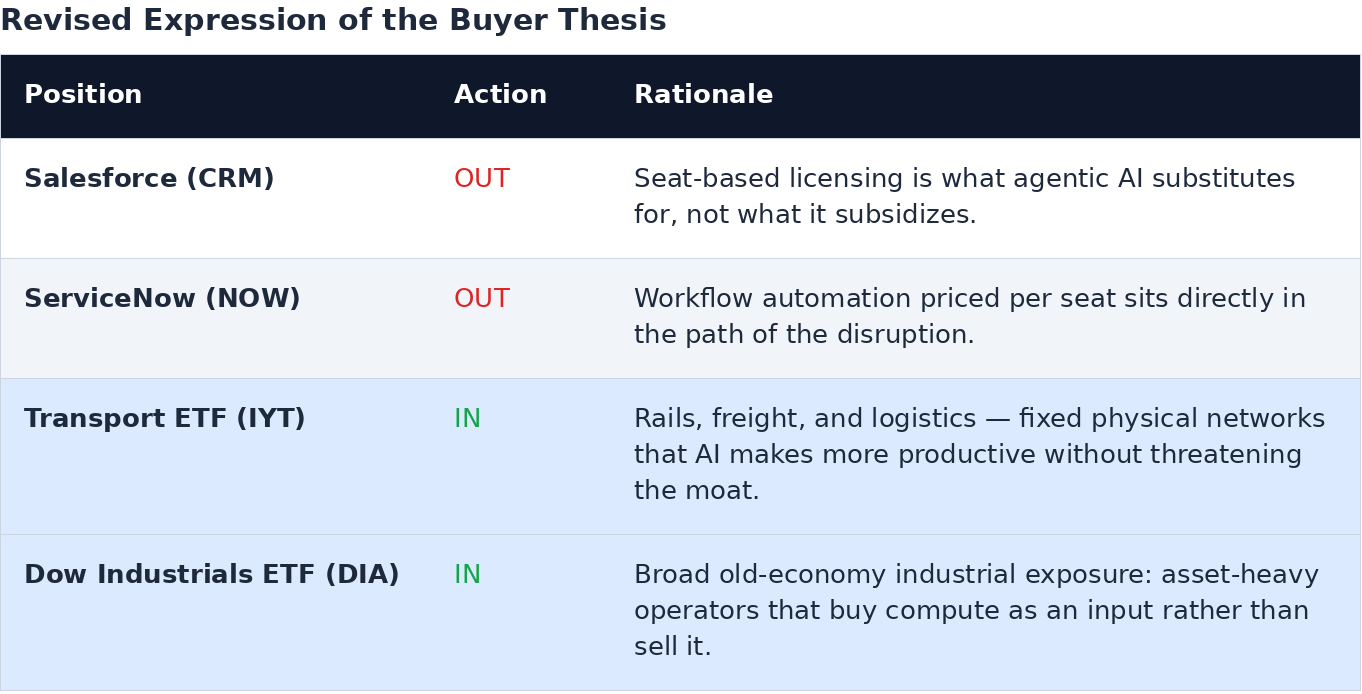
The revised expression of the buyer side, replacing the enterprise workflow software positions.
Four things would confirm the framework. Memory pricing rolling over is the cleanest single tell in the entire complex, and Micron is where to watch it. Hyperscaler capex guidance moving from acceleration to digestion would be the second. Gulf reconstruction announcements resuming would be the third, because that restarts the original overcapacity clock. And the fourth is simply whether the June-to-July rotation extends past one quarter.