After the Crisis: The Post-War Equity Playbook


How the 1927 Bull Market Maps to the 2026 Recovery and Which Stocks Win on Each Side
I. Introduction: The Pattern
Every oil-driven geopolitical crisis in American history has produced the same equity rotation: energy stocks spike during the confrontation, then flatline or decline as the resolution unfolds, while the companies that CONSUME cheap energy — technology innovators, industrial compounders, consumer platforms, and energy-importing economies — lead the secular bull market that follows.
This article maps the specific stocks and sectors that won after the 1926–27 Mexican oil crisis was neutralized, quantifies their gains and their prior declines, and then identifies the precise 2026 analogs positioned to replay that pattern as the U.S.-Iran conflict moves toward resolution.
II. The 1927 Correction and Recovery
A. The Decline
The mild recession of 1927 was driven by two simultaneous shocks: the Mexican oil crisis (which depressed oil stocks and created geopolitical uncertainty) and Henry Ford's six-month shutdown of all factories to retool from the Model T to the Model A, which laid off 60,000 workers and created spillover effects across steel, tires, and glass.
The Dow Jones Industrial Average pulled back roughly 8–10% from its early 1926 highs near 166 to a trough around 152 during the recession. The S&P Composite was essentially flat through the first half of 1927, with no new highs recorded between late 1926 and May 1927.
Oil stocks were hit hardest. The Commercial and Financial Chronicle noted in July 1927 that petroleum equities were "under a cloud" and "passing through a period of severe depression" due to low petroleum prices, having experienced "severe declines". Mexican oil company shares suffered the most brutal losses — Mexican Eagle fell 89% over the course of the 1920s, and Mexican Petroleum's share price fell by more than two-thirds between its peak and 1932.
B. The Turn: October–November 1927
The inflection point came when Ambassador Dwight Morrow arrived in Mexico in October 1927. On October 25, 1927, the New York Times reported "MEXICAN OIL STOCKS RISE HERE" — shares of American Smelting and Refining gained 2¼ points, Pan-American Petroleum traded actively higher, and National Railways of Mexico bonds appreciated a full point. The Supreme Court's November 17 ruling against the Petroleum Act confirmed the turn.
C. The Acceleration
From the October–November 1927 inflection, the Dow accelerated through every milestone without looking back:
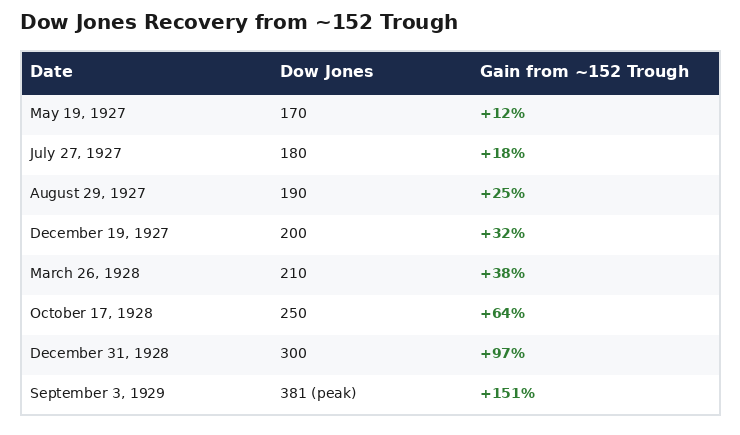
The S&P Composite returned 38.15% in 1927 and 43.81% in 1928 — a two-year run exceeding 90% that began precisely when the Mexican risk was neutralized.
D. What Drove It
Two forces converged:
- The Federal Reserve cut the discount rate from 4% to 3.5% in August 1927, explicitly to support the economy during the recession. Cheap money flooded into equities.
- The resolution of the Mexican oil crisis removed the primary geopolitical overhang, restoring investor confidence and releasing pent-up risk appetite.
The combination of easy money + resolved geopolitical risk + transformative new technologies (radio, aviation, electrification, automobiles) created the conditions for one of history's most powerful bull markets.
III. The 1927–1929 Winners: Stock-by-Stock
Using Cowles Commission data and contemporary New York Times reporting, the following stocks and sectors led the post-crisis bull market. All gains are measured from the 1924 base to the September 1929 peak unless noted.
A. Airplane Stocks: +2,106% (Best-Performing Sector)
The aviation sector was the highest-returning industry group of the entire 1920s bull market. Wright Aeronautical and Curtiss Aeroplane were the leading names. Military spending on air power combined with the dawn of commercial aviation (Lindbergh's transatlantic flight was May 1927) created an unlimited narrative.
Through the full 1924–1932 cycle: +261% (retained most gains)
Key driver: "New threat = new industry" dynamic. Government spending on defense aviation created the revenue base; commercial applications provided the growth narrative.
B. Radio Corporation of America (RCA): +1,126%
RCA was the defining stock of the 1920s bull market — the purest analog to a pre-profit AI company today.
- Rose from $5.83 in 1921 to $420 in 1928
- Split 5-for-1 in March 1929; peaked at $114.75 per split-adjusted share
- Paid NO dividend — it was a pure growth/narrative stock
- No analyst could model its ceiling because the radio industry had no historical precedent
Through the full 1924–1932 cycle: −95% (gave back virtually everything)
RCA led the boom precisely because it was un-modelable. It was transformative technology with no earnings history and unlimited potential. Its stock was driven by narrative momentum, not fundamentals — identical to pre-profit AI and quantum computing names today.
C. Electric and Gas Utilities: +855%
The electrification of America was the infrastructure buildout of the 1920s. Utility holding companies (led by Samuel Insull's empire) leveraged cheap capital to build power grids across the country.
Through the full 1924–1932 cycle: +48% (remarkably durable)
Key driver: Every factory, home, and office needed electricity. The demand curve was visible, predictable, and enormous.
The durability through the crash (+48% over the full cycle) made utilities one of the safest ways to play the boom.
D. General Motors: +851%
GM was the dominant blue-chip compounder of the 1920s — the Nvidia of its era. Unlike RCA, GM was a fundamentals story with real earnings growth at massive scale.
- Rose from $9.63 in 1921 to $22 in 1925, then accelerated to $111 at the 1929 peak — a total gain of over 1,050% from the 1921 low
- Car unit sales rose 765% from 1920 to 1929 (215,000 to 1.9 million units)
- Q3 1928 earnings: $4.42/share vs. $3.57/share in Q3 1927 — a 24% YoY increase. The New York Times reported "RECORD EARNINGS BY GENERAL MOTORS" on October 26, 1928: "$79,266,639 in quarter, highest ever achieved by any corporation"
Through the full 1924–1932 cycle: +73% (one of the few stocks that remained profitable through the entire boom-bust)
GM's durability came from operating leverage on a real secular trend (mass automobile adoption) plus manufacturing scale that competitors could not match. It was the compounding machine of the era.
E. Mail-Order Retail — Sears & Montgomery Ward: +767%
The mail-order giants were the Amazon and Walmart of the 1920s. They benefited from three infrastructure tailwinds: rural road construction, postal service expansion, and household electrification (which enabled appliance sales through catalogs).
Through the full 1924–1932 cycle: −3% (essentially flat — among the most durable holdings of the entire era)
Key driver: Rising consumer purchasing power driven by cheap energy and productivity gains, channeled through a dominant distribution platform.
F. Electrical Equipment & Agricultural Equipment: +600%+
Capital goods manufacturers that enabled the electrification and mechanization of American industry and agriculture.
Through the full 1924–1932 cycle: +6% (electrical), +18% (agricultural)
Key driver: Capex cycle beneficiaries. Cheap energy enabled factory expansion and farm mechanization, creating sustained demand for heavy equipment.
G. Chemicals: +498%
DuPont and allied chemical companies benefited from volume growth across multiple end markets — paints, plastics, munitions, agricultural chemicals.
Through the full 1924–1932 cycle: Positive (one of the more durable sectors)
Key driver: Process-industry companies that profited from volume and complexity, not commodity price direction.
H. Mining and Smelting: +464%
American Smelting and Refining was the leading name. These companies benefited from industrial demand for copper, zinc, and lead.
Through the full 1924–1932 cycle: Negative
Key driver: Cyclical commodity play that rerated on normalized trade flows after the Mexican crisis resolved.
I. Oil Stocks: +60% (Worst-Performing Major Sector)
Oil stocks were the definitive laggards of the 1920s bull market.
- Did not begin rising until 1928 — a full year after other sectors turned
- Gained only 60% from 1928 to the 1929 peak
- Dramatically underperformed every other major sector
- Mexican Eagle fell 89% over the course of the decade
- Mexican Petroleum fell more than two-thirds from peak to 1932
The Mexican oil crisis had crushed sentiment on petroleum equities, and even the Morrow resolution could not fully restore confidence. Oil was the crisis trade; it was never the secular leader.
IV. The 2026 Correction
A. The Decline
The Iran war triggered a sharp but uneven correction beginning February 28, 2026:
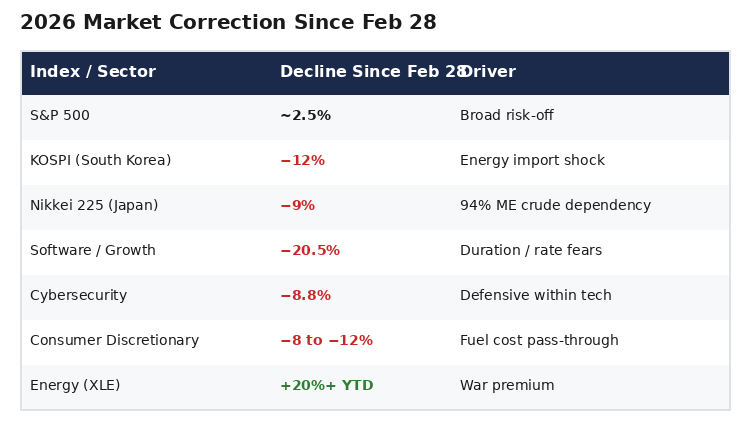
The pattern mirrors 1927 exactly: the oil-related names spike, the energy-importing economies and growth/consumer names decline, and the broad index sells off modestly while specific pockets experience severe drawdowns.
B. Goldman Sachs Bear Case
Goldman Sachs models a potential S&P 500 decline of up to 19% if the war extends and oil remains above $100/bbl for an extended period. If the April resolution thesis holds, the current drawdowns represent the buying opportunity — analogous to the October 1927 trough before the Morrow resolution.
V. The 2026 Forecasted Winners: Stock-by-Stock
A. Phase 1 Winners: Now Through Ceasefire (March–April 2026)
These monetize the spike. They are exits, not secular holds.
ConocoPhillips (COP)
- Added to Goldman Sachs conviction list March 2, 2026
- Up ~30% YTD
- Exploring a $2 billion Permian Basin asset sale to monetize at peak
- Mizuho top pick for the war period
- Trades near $115–125, ~3% dividend yield
- 1927 Analog: Pan-American Petroleum — brief bounce, long-term laggard
ExxonMobil (XOM)
- Up ~26% YTD, best-performing mega-cap in the S&P 500
- Trades near $125–130, ~3.5% dividend yield
- Scale across upstream, refining, chemicals, and LNG creates margin stability during the spike
- Over 200% total return over the past five years
- 1927 Analog: Standard Oil — solid but not a bull market leader
Chevron (CVX)
- Up ~30% YTD
- Trades near $160–165, ~4% dividend yield
- Strongest balance sheet in the integrated sector
- Leading the Venezuela reopening via new upstream deals
- 1927 Analog: Standard Oil — dividend anchor, not growth compounder
Permian Resources (PR)
- Mizuho sector pick
- Q4 EPS of $0.37 beat estimates
- Pure Permian Basin exposure = maximum leverage to hedged prices
- 1927 Analog: Small-cap oil — highest beta to the spike, first to roll over
B. Phase 2 Winners: Post-Glut Rotation (Late 2026–2027)
These are the secular leaders. Buy on weakness now; hold through the recovery.
i. Japan and South Korea: The Highest-Beta Reversion Trade
iShares MSCI Japan ETF (EWJ)
- Nikkei down 9% since war start
- Japan imports 94% of crude from Middle East, 93% via Hormuz
- Toyota, Honda, Tokyo Electron, Advantest, Fanuc, Komatsu all trading at crisis-depressed valuations
- Already granted U.S. sanctions waivers for oil purchases
- Japan and European allies signaling readiness for naval escorts
- An oil collapse removes the entire risk premium in one move
- 1927 Analog: No equivalent existed. This is a uniquely modern opportunity created by globalized energy dependency.
iShares MSCI South Korea ETF (EWY)
- KOSPI down 12% since war start — the worst-hit major market
- Samsung, SK Hynix, Hyundai at multi-year valuation lows
- South Korea is a major refining hub shut out of Iranian crude since 2019; positioned to absorb significant volumes post-sanctions
- The semiconductor names (Samsung, SK Hynix) offer double exposure: oil normalization + AI demand cycle
- 1927 Analog: No equivalent existed.
iShares MSCI India ETF (INDA)
- Nifty 50 down 10%+ from its January 2026 record high, entering a technical correction
- India imports 80–85% of its crude oil — the world's second-largest net importer at 4.6 mb/d
- Every $1 increase in oil adds ~₹16,000 crore to India's import bill; rupee hit a record low of 92.45 against the dollar
- FIIs have dumped over ₹77,000 crore in Indian equities in the first 12 sessions of March
- GDP still projected at 6.6–7.4% for 2026; U.S.-India trade deal lowers tariffs on Indian exports — a structural tailwind the oil shock has overshadowed
- An oil collapse removes India's single largest macro vulnerability in one move
- 1927 Analog: No equivalent existed. The highest-beta emerging-market reversion trade — the world's fastest-growing major economy at panic valuations because of a transient energy shock.
Zoomcar Holdings (OTCQB: ZCAR)
- India's largest peer-to-peer self-drive car-sharing marketplace; asset-light, zero-CAPEX platform serving 4 million+ users
- Nine consecutive quarters of positive contribution profit; Q3 FY25-26 record contribution profit of $1.38M at 58% margin
- Adjusted EBITDA loss improved 74% YoY; shareholder losses narrowed 91% YoY
- Pursuing uplisting to a national exchange — unlocking institutional capital currently locked out by OTCQB constraints
- India's shared mobility market projected at $50–60 billion by 2030; rising fuel costs during the crisis accelerate the shift from ownership to access-based mobility
- 1927 Analog: SEARS / MONTGOMERY WARD (+767%). A dominant distribution platform capturing rising consumer purchasing power through a scale advantage and infrastructure tailwinds. Sears monetized roads, postal expansion, and electrification. Zoomcar monetizes smartphone penetration, urban density, and the generational shift from car ownership to car access.
ii. Global Industrials: The Capex + Cheap Fuel Compounders
Caterpillar (CAT)
- Leading the 2026 industrial rotation per Morningstar
- Benefits from: AI data center construction, global infrastructure spend, lower fuel costs for end-users
- Morningstar identifies it as a top contributor to industrial sector outperformance YTD
- The industrial sector has contributed 1.36 percentage points to the US Market Index's total return in 2026
- 1927 Analog: GENERAL MOTORS (+851%). Real earnings at scale with massive operating leverage on a secular trend. GM's car sales rose 765% from 1920–1929; CAT's addressable market is expanding similarly via AI infrastructure and energy transition capex.
GE Vernova (GEV)
- Largest single-stock impact on the industrial sector's 2026 return alongside Caterpillar
- Power generation and grid equipment — direct play on AI-driven electricity demand
- Post-crisis energy infrastructure rebuild creates additional demand
- 1927 Analog: ELECTRICAL EQUIPMENT (+600%). The companies that built the power grid for the electrification of America. GE Vernova is building the power grid for the electrification of AI.
Loar Holdings (LOAR)
- Added to Goldman Sachs conviction list March 2, 2026 (alongside COP)
- Aerospace/defense components manufacturer with long-term backlog visibility
- Benefits from sustained defense spending regardless of war outcome
- 1927 Analog: AIRPLANE STOCKS (+2,106%). The defense-to-commercial crossover play. Aviation stocks surged on military spending and then extended the run on commercial applications.
iii. Consumer Defensives: Margin Expansion from Lower Freight/Fuel
Walmart (WMT)
- Leading the consumer defensive rotation per Morningstar
- Consumer defensives up +13.3% YTD as a sector
- Benefits from cost-conscious consumer spending during crisis
- A drop in fuel and freight costs post-crisis expands margins and supports same-store sales volume
- Transition from "defensive hold" to "earnings surprise" growth name
- 1927 Analog: SEARS, ROEBUCK & CO. (+767%). The dominant consumer platform that captured rising purchasing power through a scale distribution advantage. Sears was essentially flat (−3%) through the full 1924–1932 cycle — one of the most durable holdings of the era.
Costco (COST)
- Second-largest contributor to consumer defensive outperformance YTD
- Fuel station network creates a direct consumer touch-point for falling gas prices = foot traffic catalyst
- Membership model provides earnings visibility through volatility
- 1927 Analog: MONTGOMERY WARD (+767%). The slightly more speculative of the two dominant consumer platforms, but with higher upside during the expansion phase.
iv. Healthcare and Materials (Goldman Sachs Defensive Pivot)
Goldman Sachs shifted sector recommendations in mid-March 2026, favoring healthcare and materials while dropping exposure to middle-income consumer cyclicals and non-residential construction.
- Healthcare offers earnings stability independent of oil direction
- Materials benefit from commodity restocking once supply chains normalize
- 1927 Analog: CHEMICALS (+498%), MINING/SMELTING (+464%). Cyclical commodities that rerated on normalized trade flows after the Mexican crisis resolved.
C. Phase 3 Winners: Secular Compounders (2026–2028)
The transformative technology plays — the RCA equivalents.
i. Solar and Clean Energy (TAN, ENPH, FSLR)
Goldman Sachs specifically flagged that rising oil and gas prices may lead AI data center developers to boost demand for renewable energy — an upside "not currently reflected in solar stock valuations". Federal subsidy cuts under Trump have depressed solar valuations, but AI-driven private-sector power demand creates a demand floor that the market has not priced.
- Solar stocks have been beaten down by policy uncertainty — creating the same "narrative without earnings history" setup that RCA had
- The structural demand driver (AI power consumption) is independent of government subsidies
- 1927 Analog: RCA (+1,126%). No dividend. No earnings model. Pure transformative narrative. Led the boom precisely because no one could model its ceiling. Solar occupies the same structural position: a transformative energy technology with depressed sentiment and an emerging demand catalyst (AI) that the market hasn't fully priced.
ii. Cybersecurity (IHAK ETF, CRWD, PANW)
The iShares Cybersecurity & Tech ETF (IHAK) has dropped only 8.8% in 2026 while the broader software sector has fallen 20.5% — demonstrating remarkable defensive characteristics within tech. Iranian state-sponsored hacking campaigns targeting U.S. critical infrastructure create a sustained demand catalyst regardless of war duration or outcome.
Goldman Sachs flagged cybersecurity firms as benefiting from both "relative insensitivity to economic cycles" and increased cyber threats.
- CrowdStrike (CRWD) and Palo Alto Networks (PANW) are the sector leaders
- Demand is driven by threat environment, not economic cycle
- Government and enterprise spending on cyber defense is structurally increasing regardless of oil prices
- 1927 Analog: AIRPLANE STOCKS (+2,106%). The "new threat = new industry" dynamic. Aviation stocks surged in the late 1920s as military and commercial applications became apparent simultaneously. Cybersecurity occupies the identical structural position in 2026: a threat-driven industry with both government and commercial demand curves.
iii. AI Power and Grid Infrastructure (EQT, VST)
EQT Corporation (EQT): Largest U.S. natural gas producer. Direct beneficiary of AI power demand and LNG export growth. Natural gas is the bridge fuel for AI data centers.
Vistra (VST): Integrated power generation and retail electricity. Benefits from rising power prices driven by AI demand regardless of crude oil direction.
- 1927 Analog: ELECTRIC/GAS UTILITIES (+855%). The infrastructure layer that powered the technological transformation. Utilities returned +48% through the full 1924–1932 cycle — among the most durable plays of the era. AI power/grid names occupy the same structural position.
iv. Select Refiners and LNG Exporters
Refiners and LNG exporters benefit from spread and throughput, not flat oil price. Tight refining margins plus normalized crude flows support earnings even as headline Brent fades. A post-war reopening of Hormuz actually INCREASES their feedstock access and throughput volumes.
- 1927 Analog: CHEMICALS (+498%). Process-industry companies that profited from volume and complexity, not commodity price direction.
v. Wall Street Investment Banks (GS, MS)
The financial intermediaries that facilitate the capital markets boom are always among the largest beneficiaries of the bull market they enable.
Goldman Sachs (GS)
- Q4 2025 EPS of $14.01 crushed estimates of $11.65; IB fees grew 25% YoY to $2.58 billion
- Deal backlog at a four-year high; CEO David Solomon expects IB activity to "accelerate in 2026"
- #1 in global M&A advisory volume in 2025, advising on $1.6 trillion+ in deals
- Trading at ~15x earnings despite being the top global franchise in advisory and equities
- A post-crisis capital markets reopening — IPOs, secondaries, M&A, restructuring — flows directly through Goldman's core franchise
- 1927 Analog: WALL STREET BROKERAGES & INVESTMENT TRUSTS. Brokers' loans exploded from $1–1.5 billion in the early 1920s to $8.5 billion by August 1929. New stock issuance surged from $500–600 million annually (1924–1927) to $4.4 billion in 1929. Goldman Sachs itself launched the Goldman Sachs Trading Corporation in December 1928 — the financial intermediaries didn't just participate in the boom, they were the plumbing through which it flowed.
Morgan Stanley (MS)
- Q4 2025 IB revenue surged 47%; stock rallied to an all-time record high of $191.23
- Wealth Management approaching $10 trillion in client assets — recurring fees that provide earnings durability through volatility
- CEO Ted Pick called the current environment an "ideal setup" for 2026; accelerating M&A and IPO pipeline
- The dual franchise — institutional IB + wealth management — means Morgan Stanley earns fees on the deal flow AND captures the asset allocation as wealth managers deploy capital into the recovery
- 1927 Analog: Same as GS. Retail brokerages like Merrill Lynch democratized stock ownership in the 1920s, channeling middle-class savings into equities. Morgan Stanley's wealth arm plays the identical role today — the conduit through which trillions flow from cash to risk during a bull cycle.
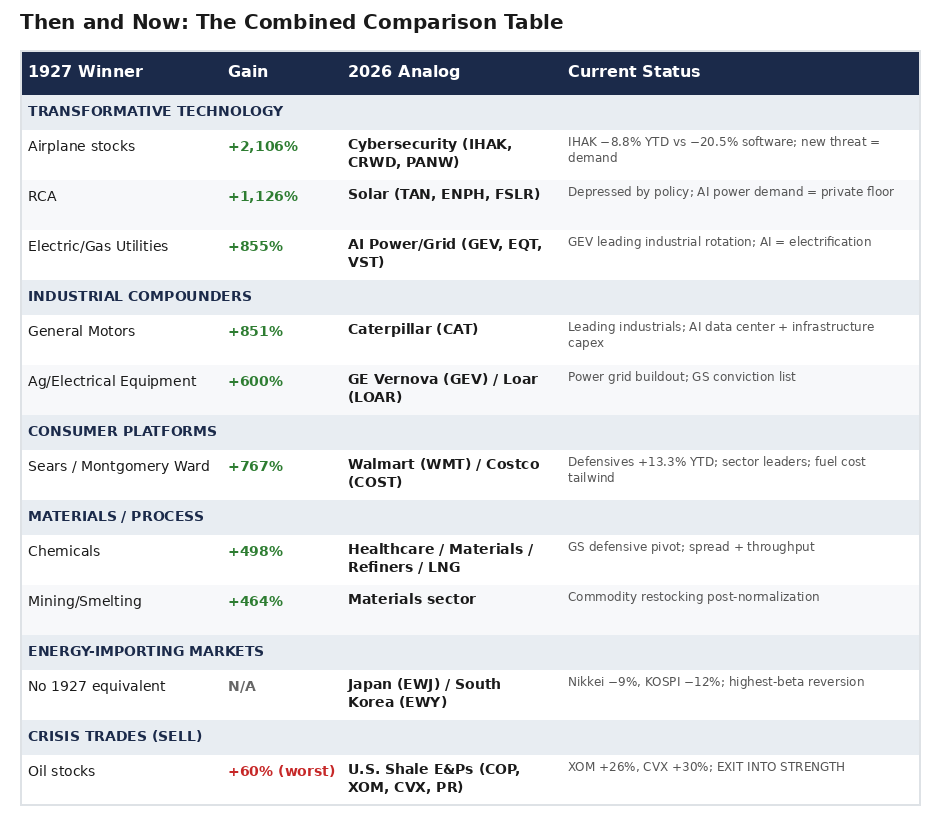
VI. Then and Now: The Combined Comparison Table
VII. What Not to Own Into the Glut
The 1927 precedent is unambiguous: oil stocks were the worst-performing major sector in the greatest bull market in American history up to that point. They gained 60% while airplanes gained 2,106%, radio gained 1,126%, and GM gained 851%. The lesson applies directly to 2026:
AVOID post-April:
- High-beta oil producers and Gulf-exposed energy names. Once Hormuz is "solved" and supply from the U.S., Venezuela, and Saudi Arabia floods the market, these names de-rate on falling strip and excess capacity.
- Pure "war premium" trades. Anything whose thesis is simply "oil stays above $100 because of Iran" is structurally short the regime-change + supply glut view. They are exits into strength, not holds.
- Middle-income consumer cyclicals and non-residential construction. Goldman Sachs explicitly dropped these recommendations in March 2026, citing the war's impact on discretionary spending and construction activity.
The Average Decline Before the Turn:
- 1927: Dow declined ~8–10% from early 1926 highs (166) to the 1927 recession trough (~152). Oil stocks suffered "severe depression". The turn came October–November 1927 with Morrow's arrival. From the trough, the Dow rose 97% to 300 by year-end 1928.
- 2026: S&P 500 has declined ~2.5% since February 28. But the real dislocations are in the pockets: KOSPI −12%, Nikkei −9%, software −20.5%, consumer discretionary −8 to −12%. Goldman's bear case is −19% on the S&P if the war extends. If the April resolution thesis holds, these sector-level drawdowns ARE the buying opportunity — analogous to the October 1927 trough before the Morrow resolution launched a two-year 90%+ rally.
VIII. Conclusion: The Secular Bull Is Built on Cheap Energy
In 1927, the companies that produced oil were the crisis trade. The companies that consumed cheap oil — and turned it into radios, automobiles, electrical grids, and consumer platforms — were the secular bull market.
In 2026, the same rotation is setting up. The shale E&Ps and integrated majors are generating record cash flow at $100+ Brent. Harvest that windfall. But the secular compounders of 2026–2028 will be the names that benefit from $50 oil: Japanese and Korean exporters whose margins explode when input costs collapse. Caterpillar and GE Vernova building the physical infrastructure of AI. Walmart and Costco expanding margins as freight costs plummet. Solar and cybersecurity companies riding structural demand curves independent of — and accelerated by — the geopolitical reset.
RCA paid no dividend and had no earnings model. It rose 1,126% because radio was going to change the world and nobody could tell you where the ceiling was. The AI power and solar names occupy that same structural position today: transformative technologies with depressed valuations, emerging demand catalysts, and no historical framework to cap the narrative.
Oil stocks gained 60%. Everything else gained 500–2,000%.
The playbook rhymes.
DISCLAIMER: This article represents analytical commentary and historical comparison. It is not investment advice. All investment decisions should be made in consultation with qualified financial advisors. Past performance of historical analogs does not guarantee future results.