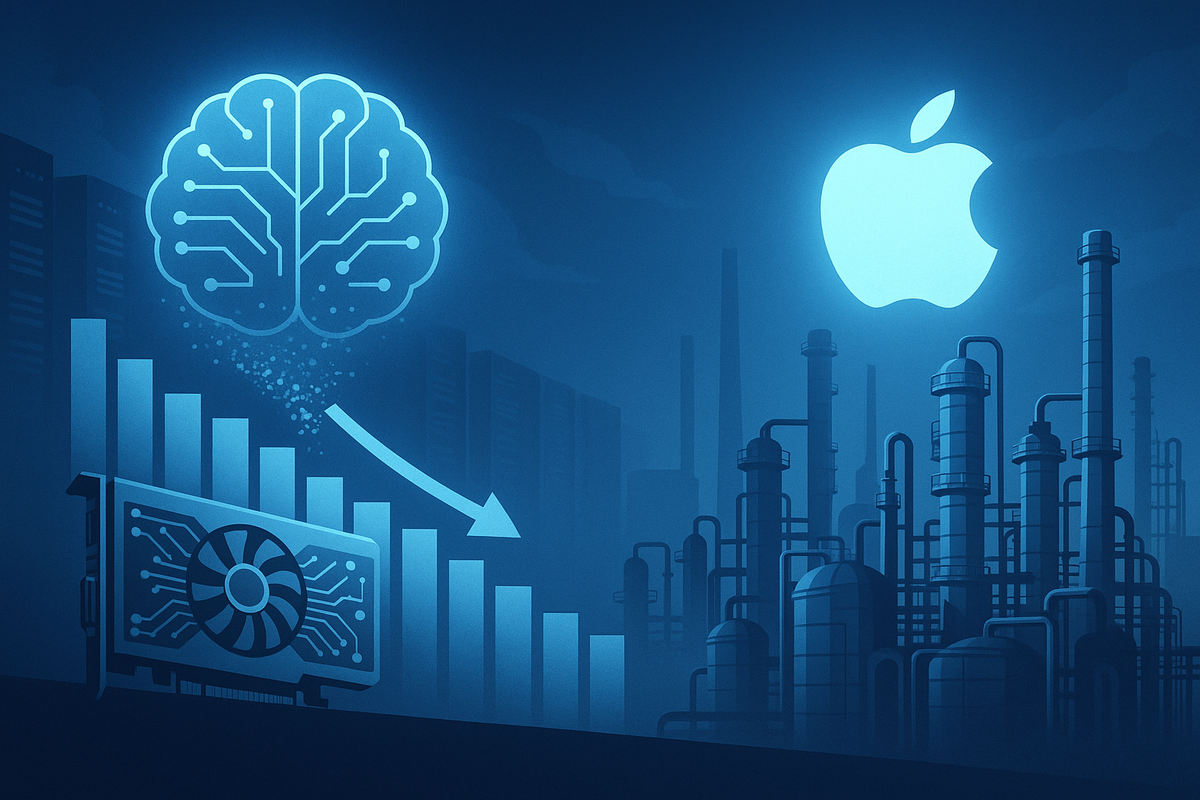
Winners and Losers of the AI Overbuild: Lessons From the 1980s Petrochemical Bust

The industrial pattern that defined the last century is repeating itself, this time in silicon instead of steel. The first phase of the AI boom has been driven by infrastructure: chips, data centers, and the cloud platforms that power them. That phase is now maturing. Valuations for Nvidia, AMD, and the major hyperscalers have peaked, just as capital spending across the AI ecosystem reaches saturation. The second phase will be defined not by those who build capacity, but by those who productize intelligence.
To understand what happens next, investors should study the last time the West exported its most advanced technology to the developing world: the petrochemical boom of the late 1970s and early 1980s. See our prior article for the extended historical analog here.
The 1980s Parallel
When Dow, Union Carbide, and ICI licensed their technology to Saudi Arabia, they believed they were expanding their global footprint. In reality, they were building their replacements. The Kingdom’s new chemical plants were so efficient that by 1985 they flooded the market, driving down global prices for polyethylene, ammonia, and methanol. Union Carbide’s market value collapsed by two-thirds, Dow and ICI restructured, and Western dominance of commodity chemicals ended.
But while the commodity producers suffered, specialty firms thrived. Companies like Rohm & Haas, Lubrizol, and PPG Industries pivoted to higher-value products such as coatings, composites, and catalysts, and their margins expanded for a decade. The lesson was clear: when capital intensity exceeds demand growth, value migrates up the chain.
Today, AI infrastructure is following the same trajectory.
The Overbuild Problem
Saudi Arabia is again at the center of a global industrial buildout. Through its sovereign wealth fund, the Kingdom is constructing more than 7,600 megawatts of AI and cloud data-center capacity, which is 25 times its current base. Across the Gulf, total planned capacity exceeds 12,000 megawatts by 2035, nearly half the world’s current installed base.
Every major Western technology company is involved. Nvidia, AMD, and Intel are shipping tens of thousands of GPUs. Amazon, Microsoft, and Google are providing architecture, capital, and software integration. But the math is as unforgiving as it was in the 1980s. The entire Gulf region, 60 million people producing 3.5% of global GDP, cannot consume 12% of global data capacity. Even assuming rapid digital adoption, projected regional demand supports only 5,000 megawatts. The rest will depend on exports, an echo of the Saudi petrochemical model.
This is why the market is beginning to reprice. Nvidia’s price-to-earnings ratio, which peaked near 56x in recent weeks, is identical to Union Carbide’s multiple at the top of the petrochemical cycle. AMD trades at an extraordinary 150x earnings, roughly five times the S&P 500. These are not sustainable levels in an industry facing overcapacity.
The Commodity Producers: High Valuations, Heavy Risk
Like Union Carbide and BASF in the early 1980s, the commodity producers of this era, chipmakers and hardware-dependent infrastructure firms, face the steepest downside.
- Nvidia (NVDA) remains the dominant supplier of AI accelerators, but as data center overbuilds and Chinese competition mount, margins are likely to compress. Historical analogs imply 40% to 60% downside from peak valuations.
- AMD (AMD), with its extreme multiple near 150x, represents pure speculative excess, pricing in perfection in a sector entering its saturation phase.
- Broadcom (AVGO), though diversified, is still tied to hardware cycles; it could follow BASF’s 1981 trajectory, down 50% as demand normalizes.
- ASML will remain technologically essential but cannot escape utilization risk if fabs run below capacity.
- Data Center REITs, including Digital Realty and Equinix, mirror the petrochemical storage firms of the 1980s: indispensable but overbuilt, facing 40% to 60% potential drawdowns as utilization rates fall.
These are the “commodity chemicals” of the AI era, critical to the ecosystem, but vulnerable once growth slows.
The Integrated Platforms: Survivors, Not Leaders
In every industrial cycle, a few integrated players endure. Exxon survived the oil crash because its scale and diversification allowed it to adapt. The digital equivalents, Microsoft, Amazon, and Google, will not escape margin compression, but they will endure.
- Microsoft (MSFT), trading at 36x earnings, will face near-term pressure in Azure’s profitability but benefit long term from enterprise AI integration.
- Amazon (AMZN) has pricing power through AWS but faces falling cloud margins as compute costs deflate.
- Google (GOOGL) trades at a discount to the market and may prove the most resilient of the hyperscalers, with diversified ad and cloud revenue.
These firms will likely see 15%–30% drawdowns, but unlike pure hardware suppliers, their margins and balance sheets allow for adaptation.
The Specialty and Adaptive Winners
The real opportunity lies where it always has: specialization. In the late 1980s, Lubrizol, PPG, and Sherwin-Williams escaped the petrochemical downturn not by building more capacity, but by shifting into high-margin, application-specific products. Their modern equivalents are software, platform, and systems companies that monetize intelligence rather than infrastructure.
- Apple (AAPL) stands out as the most underappreciated beneficiary of the AI cycle. While hyperscalers spend tens of billions chasing data-center scale, Apple avoided the overbuild entirely. It owns its entire mobile-compute distribution layer—the hardware, the OS, the App Store, and the customer relationship. As AI usage shifts from centralized inference to on-device execution, Apple captures the profit pool without the capex burden. The company’s real estate is 2.2 billion active devices, the single most valuable footprint for AI deployment in the world. With minimal incremental capex and superior operating leverage, Apple’s upside in the adaptive-AI era remains considerably underestimated.
- SAP (SAP) remains undervalued at roughly 0.9x the S&P’s multiple despite commanding an enterprise software moat comparable to Lubrizol’s post-commoditization dominance. A normalized valuation implies 60%–80% upside as AI-enabled workflows deepen systemwide reliance on SAP’s core infrastructure.
- Palantir (PLTR) has emerged as the integration layer for enterprise and government AI. Its premium valuation is justified. As agentic systems scale from workflow automation to fully autonomous decision cycles, Palantir’s operating leverage supports 50%–100% additional upside.
- PPG Industries (PPG) and Sherwin-Williams (SHW), the literal survivors of the last overbuild cycle, remain undervalued by 40%–100% relative to normalized specialty-chemicals multiples. Their historical role as high-margin consolidators is directly analogous to the firms that will dominate the specialty layer of AI.
- Uber (UBER), still trading at roughly half the S&P’s multiple, is the clearest adaptive-economy story. Uber turns data into real-time coordinated logistics, exactly the type of high-feedback, agentic system that benefits most from falling compute costs.
These companies sit where the next cycle’s profits will migrate: low capital intensity, high intellectual leverage, and recurring margins. They are not building the infrastructure; they are monetizing the intelligence that runs on top of it—the same shift that separated the winners from the wreckage in the 1980s.
The Rotation to Intelligence
The historical analog is exact. Between 1978 and 1983, petrochemical capacity tripled and valuations peaked; between 1983 and 1990, the specialty sector compounded wealth quietly while commodity firms languished. The AI cycle is following the same arc: 2022–2026 marks the overbuild; 2026–2032 will mark the rotation to intelligence.
As compute becomes abundant and cheap, value will shift to the software layer—autonomous systems, decision engines, and agentic AI platforms that can reason and act without constant human input. These are the “specialty chemicals” of the digital era.
The Investment Roadmap
The winners will not be those who build the infrastructure, but those who use it better than anyone else. The losers will be those who mistake scale for profit.
- Avoid: Nvidia, AMD, Broadcom, ASML, Data Center REITs.
- Hold: Microsoft, Amazon, Google.
- Buy: SAP, Palantir, Uber, PPG, Sherwin-Williams, Apple.
Industrial history is rhyming with surprising precision. The same forces that crushed the petrochemical titans of the 1980s are now building the foundations of the next transformation. From commodities to cognition, from infrastructure to intelligence, capital is once again on the move.
APPENDIX:
Comprehensive Comparison Tables for the AI Infrastructure Cycle
Table A1. Comprehensive AI Cycle Comparison Matrix
(1980s Petrochemical Cycle vs. 2025 AI Infrastructure Cycle)
|
Category |
1978–1990 Analog |
P/E vs. S&P (Analog) |
2025 Analog |
P/E vs. S&P (2025) |
Position in Cycle |
Outcome / Prediction |
|
Commodity Chip |
Union Carbide (1980) |
1.3–1.7× premium |
Nvidia |
1.86× premium |
Peak capacity expansion |
–60% to –70% |
|
Volatile Commodity |
Union Carbide (1980s) |
0.5–0.7× |
AMD |
4.0× |
Peak capacity expansion |
–70% to –80% |
|
Integrated Giant |
Exxon |
1.0–1.3× |
Microsoft |
1.20× |
Core platform integration |
–20% to –30% |
|
Integrated Diverse |
Exxon |
1.0–1.3× |
Amazon |
1.16× |
Retail + AWS |
–15% to –25% |
|
Integrated + Commodity |
Dow Chemical |
1.0–1.3× |
Google |
0.90× |
Ad + Cloud |
–10% to –20% |
|
Equipment Supplier |
Equip. firms (1980s) |
1.0–1.2× |
ASML |
1.25× |
Fab equipment saturation |
–30% to –60% |
|
Specialty Applications |
Lubrizol |
1.3–1.8× |
SAP |
0.90× |
Enterprise systems |
+60% to +80% |
|
Specialty Government |
Lubrizol |
1.3–1.8× |
Palantir |
2.3–2.6× |
AI systems integration |
+50% to +100% |
|
Transformation |
DuPont / Albemarle |
1.2× |
Uber |
0.5× |
Adaptive logistics |
+60% to +120% |
|
AI Consumer Layer |
Industrial users |
0.8–1.2× |
Apple |
1.10–1.15× |
On-device AI, owns distribution |
+40% to +85% |
Table A2. Nvidia vs. Union Carbide Capacity-Cycle Comparison
|
Metric |
Union Carbide (1980) |
Nvidia (2025) |
|
P/E vs S&P 500 |
1.3–1.7× premium |
1.86× premium |
|
Position in Cycle |
Peak capacity expansion |
Peak capacity expansion |
|
Stock Performance at Peak |
Near all-time high |
–0.1% from all-time high |
|
Next 5 Years Outcome |
–67% decline |
–60% to –70% expected |
Table A3. Supplemental Analog Outcomes
|
Firm Type (1980s) |
2025 Equivalent |
Expected Outcome |
|
Commodity chemical exporter |
Chipmakers (NVDA, AMD) |
Major multiple compression, –50% to –70% |
|
Storage & transport infrastructure |
Data center REITs |
–40% to –60% as utilization falls |
|
Integrated oil majors |
Microsoft, Amazon |
–15% to –30%, survive but compress |
|
Specialty chemicals |
SAP, Palantir |
+50% to +100% |
|
Adaptive manufacturing |
Apple, Uber |
+40% to +120% |


